I can't put every average and every timeframe up and I can't say definitively we won't have more jiggles like this morning's move to the upside, but I'd use those to enter positions on price strength.
Here's a sampling of some of the charts that are just at the point in which they are SCREAMING, the kinds of divergences I never ignore and while they are on multiple timeframes (full house), it's the longer term ones that are especially dangerous.
I have marked a few past divergences just for reference, the current ones should be easily identifiable and their size should tell you the same thing I have been showing for some time.
First the actual trigger, at least as of the 12/12 forecast.

In fact the very forecast and challenge to members was the following on October 15th, in the Daily Wrap
"I suspect we will see a sharp upside move taking out shorts and breaking above obvious resistance like 200-day moving averages and top trendlines as well as the August lows, remember these moves HAVE to be convincing, it doesn't mean there's a real change in character so if and when the time comes to start shorting in to that strength, it's a gift, although you can bookmark this post, I promise you , you will not feel it is safe to short in to strength as the market moves higher on a bounce like you do now, the moves are that convincing, which is all the better for entering new or adding to existing shorts."
This was written before the first sign of a move higher, after a decline that had everyone bearish and calling a top; this was the stage 1 base which we saw accumulation for and therefore could forecast a sharp move higher that would be so strong, I felt I needed to anchor expectations before the move started with a challenge to book mark the post as everyone was so bearish, it was inconceivable at the time that such a strong move could take place.
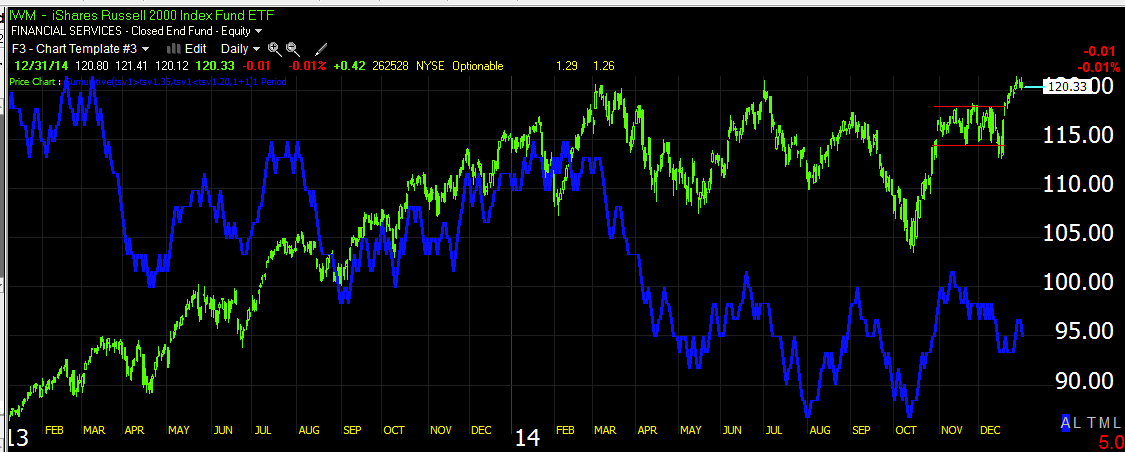
The rally is stage 2 "Mark-up", the area of what turned out to be a 6 week IWM range that didn't move more than -.38% over the 6 trading weeks was the stage 3 top and as we always look for just before a reversal whether up or down, the head fake move above the stage 3 top or in this case the IWM's 6 week range at "HF", next comes stage 4 "Decline". Once the IWM breaks below $118, the bull trap is locked and it should create insane downside momentum.
I tried to mix up the timeframes a bit so you get a sample of all of them.


Some of you have seen my post of the 1929 Dow 3C chart vs the current Dow 3C chart, the current one is much, much worse.


3C has made a series of new leading negative lows well below the October lows level.

Again, a new leading negative low in 3C.


Again, I'd use any short term price strength as a tactical entry in to positions I like (short) such as the SQQQ/QQQ short in to today's early strength.


No comments:
Post a Comment