In any case, they report tonight after the bell.
In the last update for MCP, MCP Follow Up / Trade Set up
Here are the excerpts so you know what happened...
"Last week on April 22nd MCP broke out of a large triangle base on a strong price move of at least +5.68% when I wrote about it, but something didn't look right and I exited the trading long position that day, here are the posts from last Tuesday and excerpts.
MCP (long) Position Follow Up... 1:33 p.m. April 22nd
"I'm not sure yet if today's move is the start of mark-up or a transition form the stage 1 base to stage 2 mark up, I'd like it to be, but so far we have a parabolic move (granted there's nice volume) and very little in the way of intraday confirmation so far, that can change in a hurry.
For now I am keeping the MCP long open, but if I don't see some improvement or I see deterioration, I may close out the trading position on today's move of +5.68% thus far...
A breakout of a triangle like this at its apex is a clear technical trading buy signal, what bothers me is there was no head fake/ stop run on a very obvious support level, first. Thus, if I feel this is going to end up being a false start, I'd likely try to book the gains, get out and wait for what would more likely than not, be a head fake move below support, that's where I'd want to re-enter, but lets give this a little time and see how things pan out."
Closing MCP Long Trading Position For Now 3:21 p.m. April 22nd"
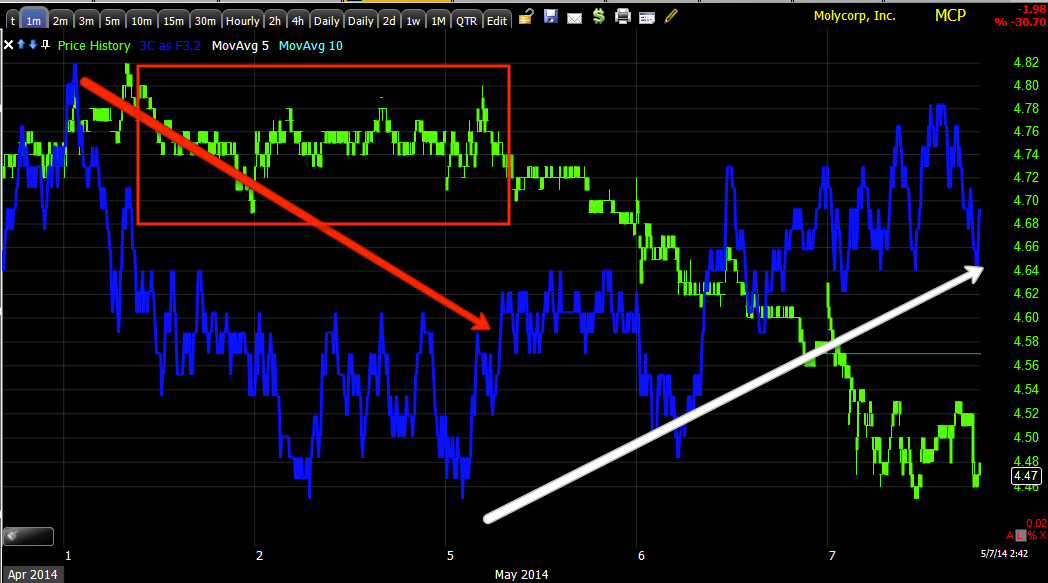
Here's what we have now, this isn't quite the head fake move I had imagined, but if there's a leak in MCP's earnings, this would be exactly what I'd imagine...


Now we have that move below support, one of the things I was looking for to establish a new trading long position.


And the 3 min chart.
The problem is, a reversal process of a head fake move would look like this, but I'm going to go ahead and take a chance and open a Half Size trading position in front of earnings (equity long), as there's just too much there that looks out of place or, lets just say, "manipulated".


No comments:
Post a Comment