So it's been challenging to sit still today if you saw some of the charts I've seen and I don't think I'd blame anyone for going ahead with some positions here (market short), I'll try to give you an overview of what they (the charts) are looking like.
Something is bugging me though and it's not something I can easily describe. When you look at several hundred charts (futures, watch lists, averages, etc.) you get a feel for things and while it's almost impossible to point to a very specific example, something has kept me with the few positions opened as well as the core shorts left open , but not adding too aggressively in to some very ugly charts. I can't quite put my finger on it and maybe it's just me having grown very cautious over the years rather than "Well, lets play this and see how it goes".
In any case, here's a sampling of the major market averages. There are a lot of charts here, but I had a feeling I'd have time to collect them.
SPY 2 min today
SPY 5 min with a nasty leading neg. div. , possible head fake, but not very convincing.
Either way, there's little doubt about the deterioration, just a little about where the best timing/entry is.
SPY 10 min at new lower lows today so that's resolving well.
IWM 1 min intraday distribution of price gains as we have seen most of the bounce.
IWM 5 min bounce trend leading neg.
IWM 10 min, close, but not quite what I was hoping for by the time we should be at a transition point.
QQQ intraday
QQQ 2 min trend of the bounce area
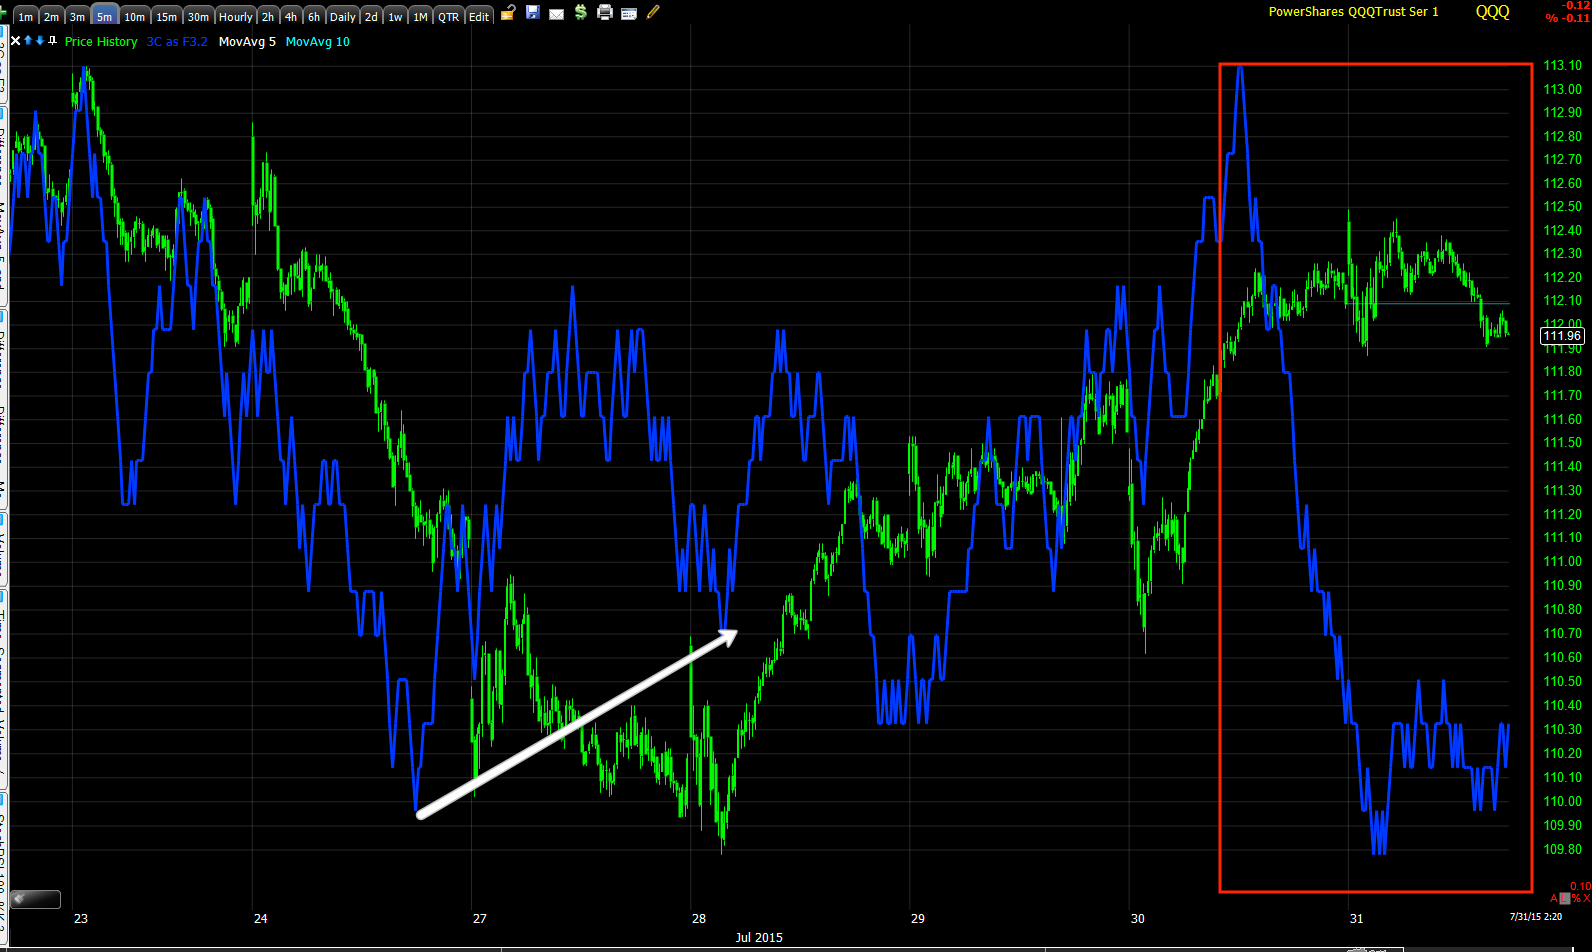
QQQ 5 min nasty divergence from yesterday.
And it looks like it's finally migrating to the QQQ 10 min chart,
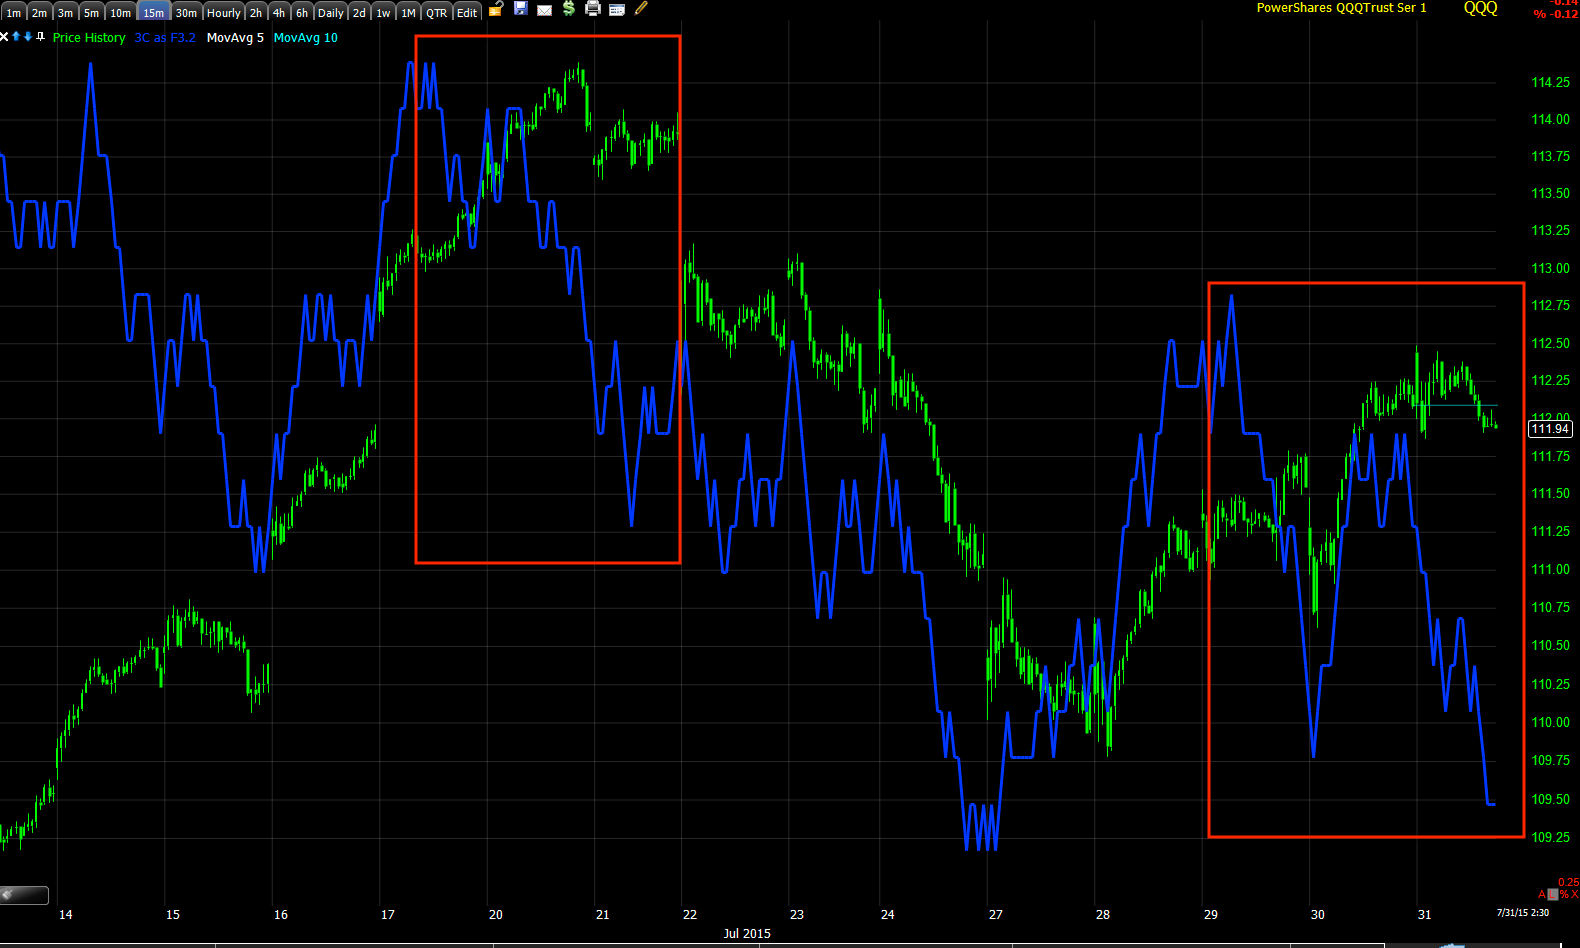
QQQ 15 min at the previous bounce top and now. Overall this looks pretty good for a downside move.
As for the levers, the main one HYG...
Intraday charts turned although there was early support.
2 min chart leading big time
5 min with the early warning before the low as usual and a leading negative divergence.
I just wish HYG was leading the market a bit more to the downside and not moving with it.
HYG's longer term downtrend.
VXX looks like it might be finding some intraday resistance which would make the caution thus far well founded, although I have no problem with the UVXY long position.
UVXY 2 min, with what should be a head fake, volume was only showing 1 spike earlier, I'd like to see 3C at a new leading high as a move below support should accumulate stops. This isn't a bad chart by any means, just a slight annoyance.
VXX, et. al.
XIV 3 min I think should be showing a worse leading divergence.
The 5 min chart looks pretty darn good for a VXX long.UVXY long.
And the intraday TICK. I had a feeling earlier before I started the post that the ROC in TICK would be putting in a possible intraday support toe-hold which is why I took the time to put together all of these charts.
The Custom TICK Histogram shows today and the most recent little intraday improvement.
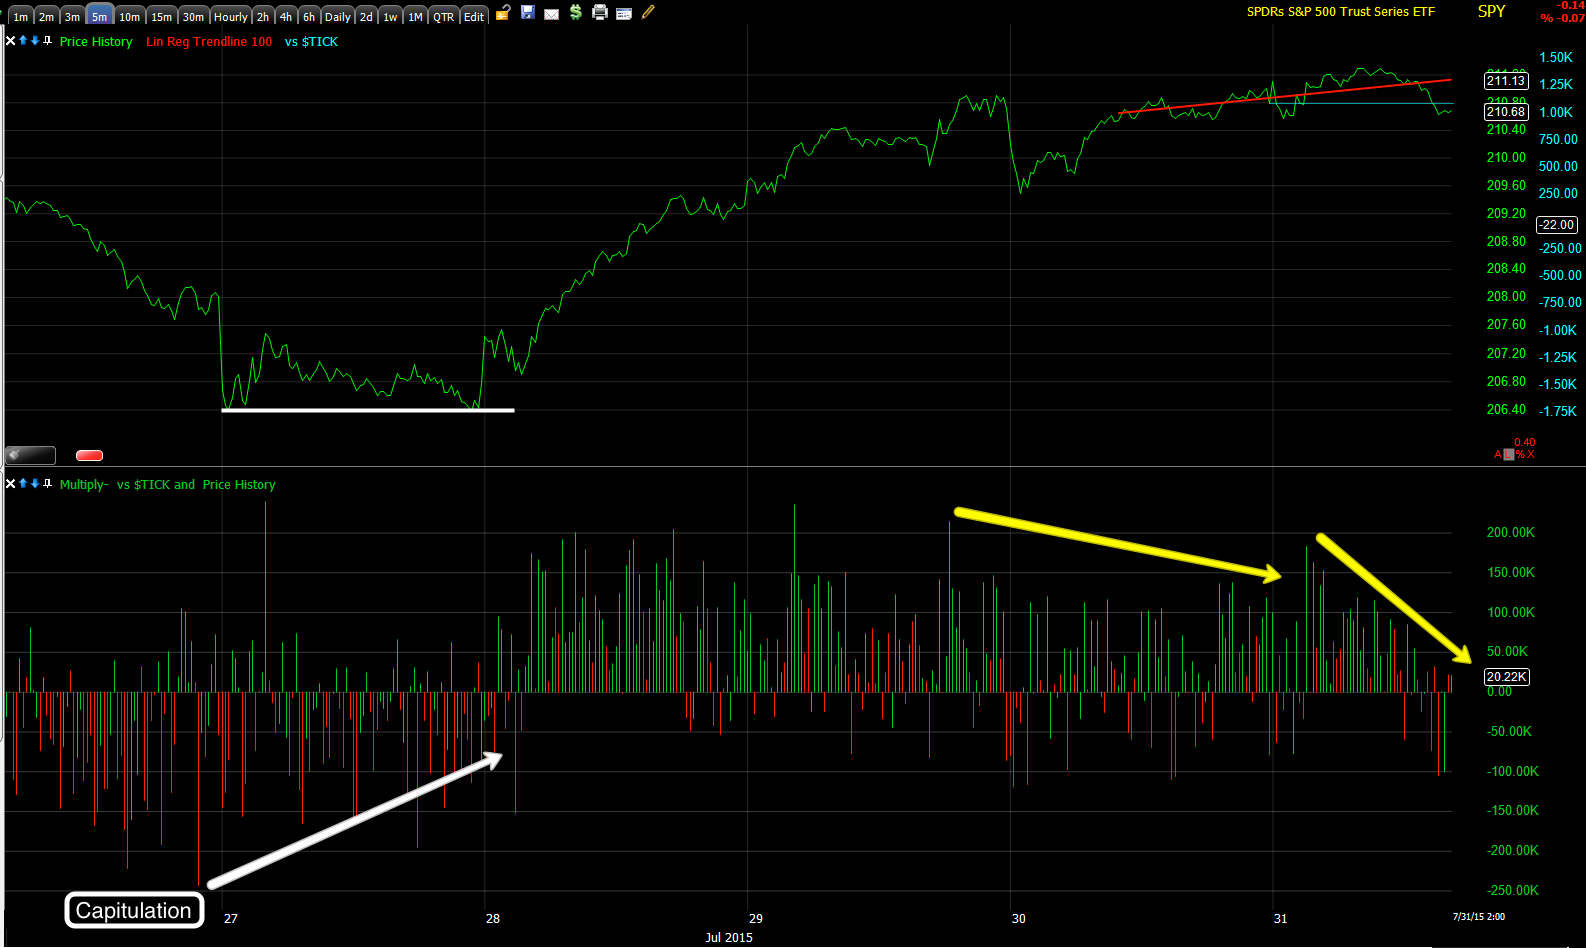
Here's the base for the bounce with capitulation first, then the base forms and then breadth deteriorates as it should.
Vs. the last/bigger bounce we have the same concepts of a downside capitulation event, a base, mark up and decline, but note the intraday breadth has been a bit stronger on this smaller bounce so I kind of expect a bit more form it
I'm going to check leading indicators, I may just get some additional partial positions or longer term positions that can ride out some volatility because these charts don't look god, there's just something nagging me still.


No comments:
Post a Comment