We are green for 2015, well at least for a bit today any way.
The market continues to have a very strange look about it, especially intraday breadth. To me it looks like intraday charts and price action are starting to roll negative.
While the chart is not SCREAMING or jumping off the screen, the intraday SPY (1 min) continues to deteriorate.
Other than the opening ramp, there hasn't been much activity the rest of the day, see the R2K futures below...
The overall negative tone trend pops out on this intraday Futures chart of R2K, but also note that beyond the opening ramp, not much has happened since.
The SPY 2 min is showing some change in character as well, it isn't screaming at this point, but it is moving in that direction at a pretty steady pace.
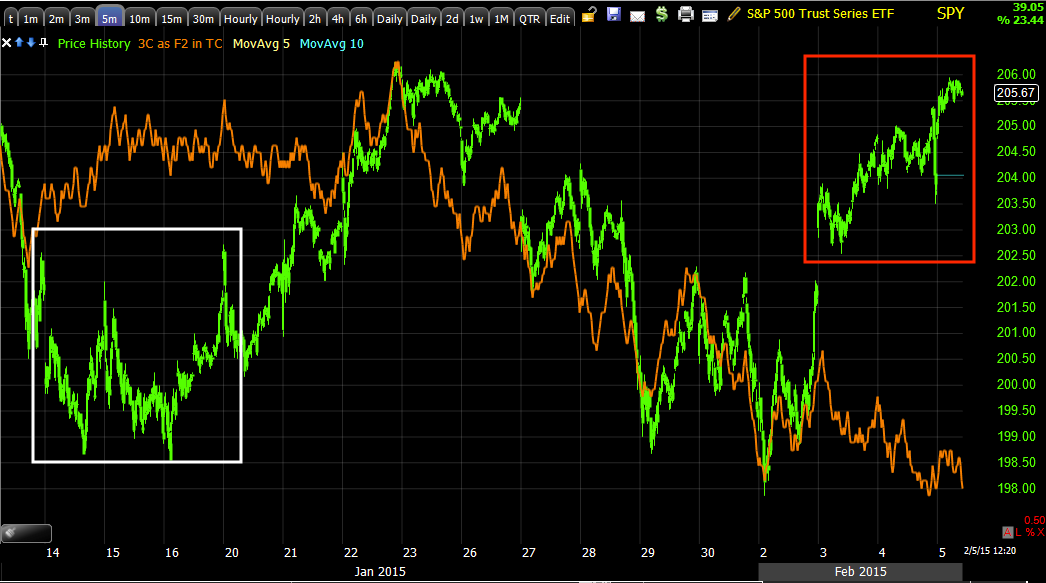
Of course the highest probability for the resolution of this move is seen in all of the averages on their 5 min charts, this is not good as this is one of the earliest, serious timeframes, 5 min which is what I consider to be the earliest timeframe showing institutional activity.
The SPY trend since the October cycle has also shown very clear deterioration, especially since 2015 started.

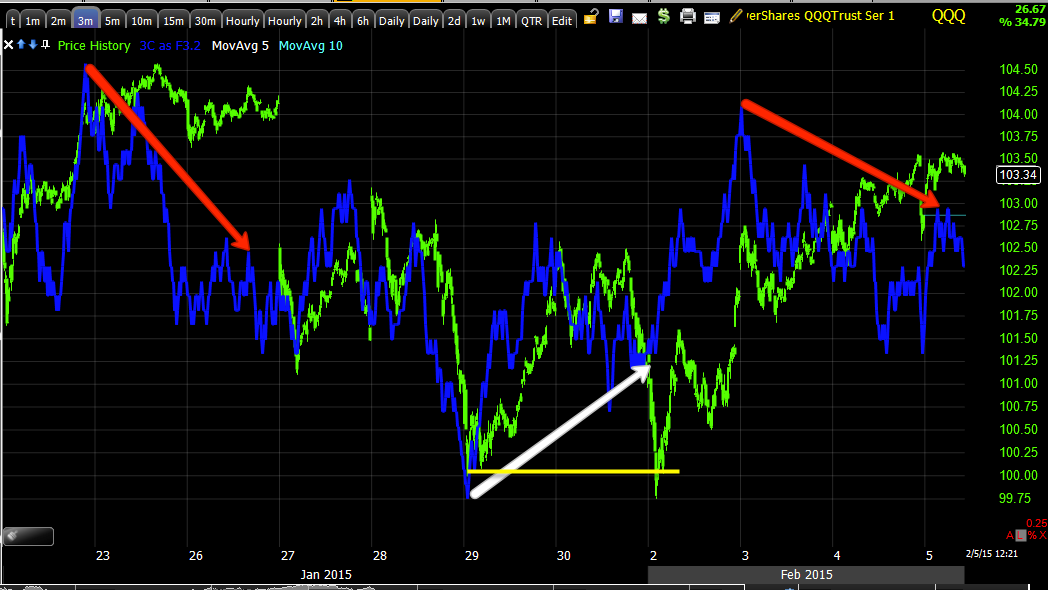
Q's intraday are showing similar consistent negative activity, while not screaming or jumping off the chart, if it keeps this up, it won't be long before it is screaming and popping off the chart.
QQQ 3 min which is where the positive divegrence reached for this most recent swing in the large choppy range is also clearly turning negative.
And the 5 min chart with the reversal process.
I put the 10 min chart in the post just to show the reversal process, sometimes we watch the market so closely we expect things to happen faster than what is reasonable, so I thought I'd show you what has been reasonable in recent past reversals.
Note that each top side reversal is proportionate with the preceding trend, the larger the uptrend was, the larger the topping reversal process. Also note that as usual, downside reversal areas are almost always much tighter than upside reversals, this has been something we have seen for a long time and nothing unique to this particular market/time period.
The overall trend of the 3C chart is probably one of the most important pieces of information on this chart.
IWM 1 min is also acting like SPY/QQQ today, which is uncharacteristic for recent action on the timeframe.
And the 3 min IWM in the chop range and the different cycles including the 6th, the 14th-16th and the most recent one as well as their distribution areas and reversals.
And other than the 5 min chart leading negative in the most recent cycle like all of the other averages, again the most important data on the chart is the trend of 3C through the entire zone of chop.
Sometimes these choppy ranges can be bases, but I think we can rule that our judging by the 3C trend through the range.
And what is grabbing my attention most today as a "Strange market" is the NYSE TICK, usually there's some trend, this trend is pure lateral, no extremes in the TICK at all, pretty much in a very tight range between + and - 500. Very odd.


No comments:
Post a Comment