This was yesterday's MCP post, it describes essentially what happened, what we'd like to see happen next, etc,
MCP Closing Update.
As for today, MCP is showing some productive signals, although I wouldn't call them the kind of signals I'd enter a new trade on, but moving in the right direction so far.
A consolidation, whether it be through price or through time is usually more than just a 1-day event, especially after a move of over 200% in just over a week so several days of consolidation are realistic, it also gives us the time needed to see if the initial improvements seen today continue to develop and turn this consolidation in to a new high probability opportunity.
The probabilities for additional upside in MCP are still high as this 60 min chart is leading positive. We'll want to see the chart stay that way and maybe even improve, we don't want to see it deteriorate.
I drew in an additional daily candle on the 1-day chart, at bare minimum I'd prefer to at least see another day of consolidation in the area with a bullish reversal candle or multiple candle formation.
I drew in a Doji Star in yellow which would be an acceptable candle in and of itself, but notice I also drew it so that today's lows on a bullish hammer and tomorrow's on the star form a 2-candle reversal (bullish) known as a "Tweezer Bottom" in which the intraday lows of today and tomorrow are nearly exactly the same. There are numerous other forms the candlesticks could take and still be a bullish signal and it could be several additional days as well and still be bullish, this is just a broad concept of what would be nice to see at a minimum (at least 1 more day of consolidation).
The 1 min intraday chart shows the negative at yesterday's highs which we had warned about in advance of those highs and today's action shows a relative positive divegrence, we'd want to see this strengthen significantly and lead positive.
The 3 min chart shows the same basic signals of a negative at the highs and a positive tone since on the pullback, again, we'd want to see this continue to improve, the extra time (day +) would give MCP the change to demonstrate that improvement on the 3C charts.
Here the 5 min chart isn't negative today nor is it very positive, it really hasn't moved much. I drew in a blue arrow of the basic concept of what I'd like to see in 3C, some sort of leading positive divegrence, especially in to another day of relatively flat prices.
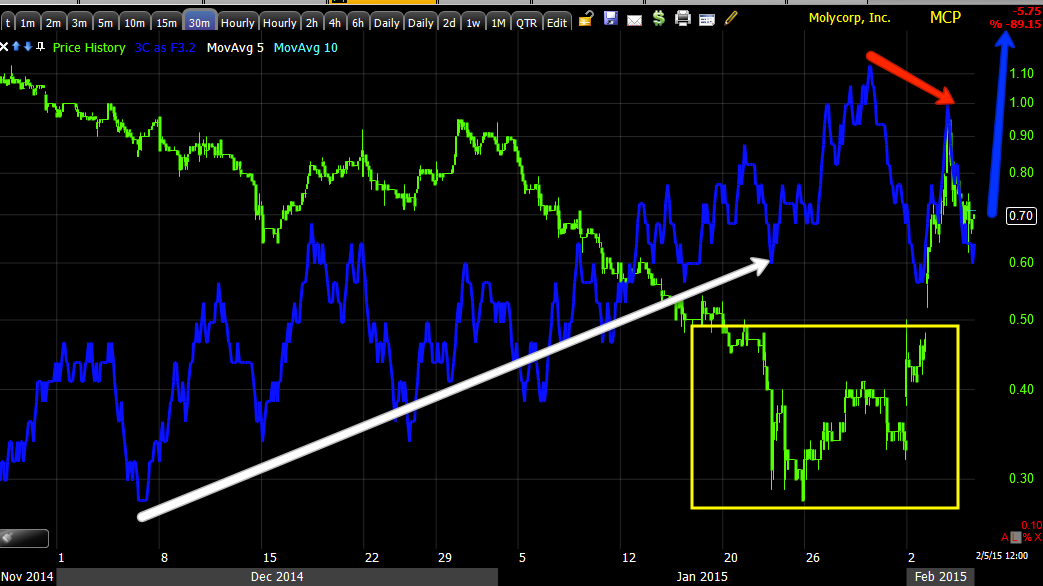
And the same holds true for the 30 min chart which hasn't moved much yet and that's not surprising given the short time we've had since the consolidation, but again I'd like to see 3C move to a more leading positive position and at that point we'd want to look for that bullish reversal candlestick on heavier volume than the preceding day, that would likely be our high probability entry.
These are some of my favorite trade set ups as price and 3C must prove themselves first before you take a position (unless you are holding in which case the 60 min chart is still the highest probability resolution (to the upside).
So far, everything looks pretty good, I'm actually surprised we haven't seen a deeper pullback, but as I said, consolidations can take place through price or through time (sideways).


No comments:
Post a Comment