Considering the obvious triangles, CNBC and JPM's additional pointing out of the obvious triangles in what were not quite "fair and unbiased" reviews, calling them consolidation/continuation patterns which "could" (CNBC must maintain plausible deniability), breakout to a new leg higher.
THIS IS EXACTLY WHAT WAS FORECASTED ON APRIL 2ND AND TO GET TECHNICAL TRADERS CHASING PRICE BASED ON THIS VERY IDEA, THE EASIEST WAY TO CREATE DEMAND AND HIGHER PRICES TO SELL IN TO FOR SMART MONEY IN A MARKET THAT HAS OTHERWISE BEEN LATERALLY RANGEBOUND ALL OF 2015.
If you saw this weekend's posts, the first of which detailed the April 2 forecast, you'd know this is exactly the head fake move ABOVE the triangles I was looking for. This is more about using technical traders' knowledge and predictability against them in what amount to market-based psychological war-fare. This is why I was disappointed in Thursday's less than
emotionally moving, half a percent price gains and why Friday's QQQ move was much more in line with what we were looking for. You'd also see how these triangles we're not random or naturally occurring, but had specific divergences to create them which was specifically shown in the April 2nd forecast.
It would seem to me the market is much weaker then it looks if J.P. Morgan and CNBC have to come out the same morning after a weekend with the QQQ move and ATNHs and direct everybody's attention to these triangles which are very hard to miss the first place. I suppose everyone wants their work to be seen and appreciated, especially when your company may be on the line. Sorry for the rant, I was just surprised this morning by the additional pandering to the perma-bulls after such an obvious set up that any first month technical trader should be able to spot.
As for the market action intraday, it's not what I expected. I thought that we'd see stronger moves in the averages (especially in the morning) that didn't make impressive, emotionally moving gains like SPX, Dow and Russell 2000 (unlike the NDX on Friday).
The charts also look to be in a dangerous place from a daily candlestick perspective.
Most of the averages have something similar to a Star, Evening Star or Doji Star from Friday's close, all of which are bearish reversal candles (
unconfirmed). Additional weakness is seen above at Thursday's close with a long upper wick on the candle (
to the left inside the yellow box). Today's gap up is a pre-requisite to Bearish Engulfing candle which would need to close below the low of the Friday candle's real body. This would be bearish candlestick reversal confirmation of Friday's reversal candles.
As for the intraday charts so far today...
DIA
As you can see, the DIA intraday chart is not only showing weakness in general but strong intraday weakness on today's gap up. Quite often the one minute chart Will be the last to turn significantly for the divergence, acting as a sort of timing signal.
DIA 2 min. should have easily confirmed by now in which case the yellow 3C line would be following the green price candles.
QQQ 1 min intraday shows a negative divergence at this morning's intraday highs.
The 2 min QQQ intraday chart speaks for itself. Although interestingly the strong negative divergence only takes place once the QQQ makes a break out above the triangle's resistance (shown below).
This would indicate confirmation of exactly what we were looking for, A head fake move. Otherwise 3C would be confirming price action, instead it sees a stronger leading negative divergence at the very area retail traders would chase price in the very area I believed specifically created, triangle resistance.
The divergence above in QQQ takes place upon the breakout above this descending triangle. Once again note the gap up as a prerequisite for a Bearish Engulfing candle.
IWM
The IWM also shows no confirmation on the fastest timeframe, 1 min. If there was confirmation it would literally be almost an immediate on this fast of a timeframe.
IWM 2 min trend seeing an increased leading negative divergence.
SPY
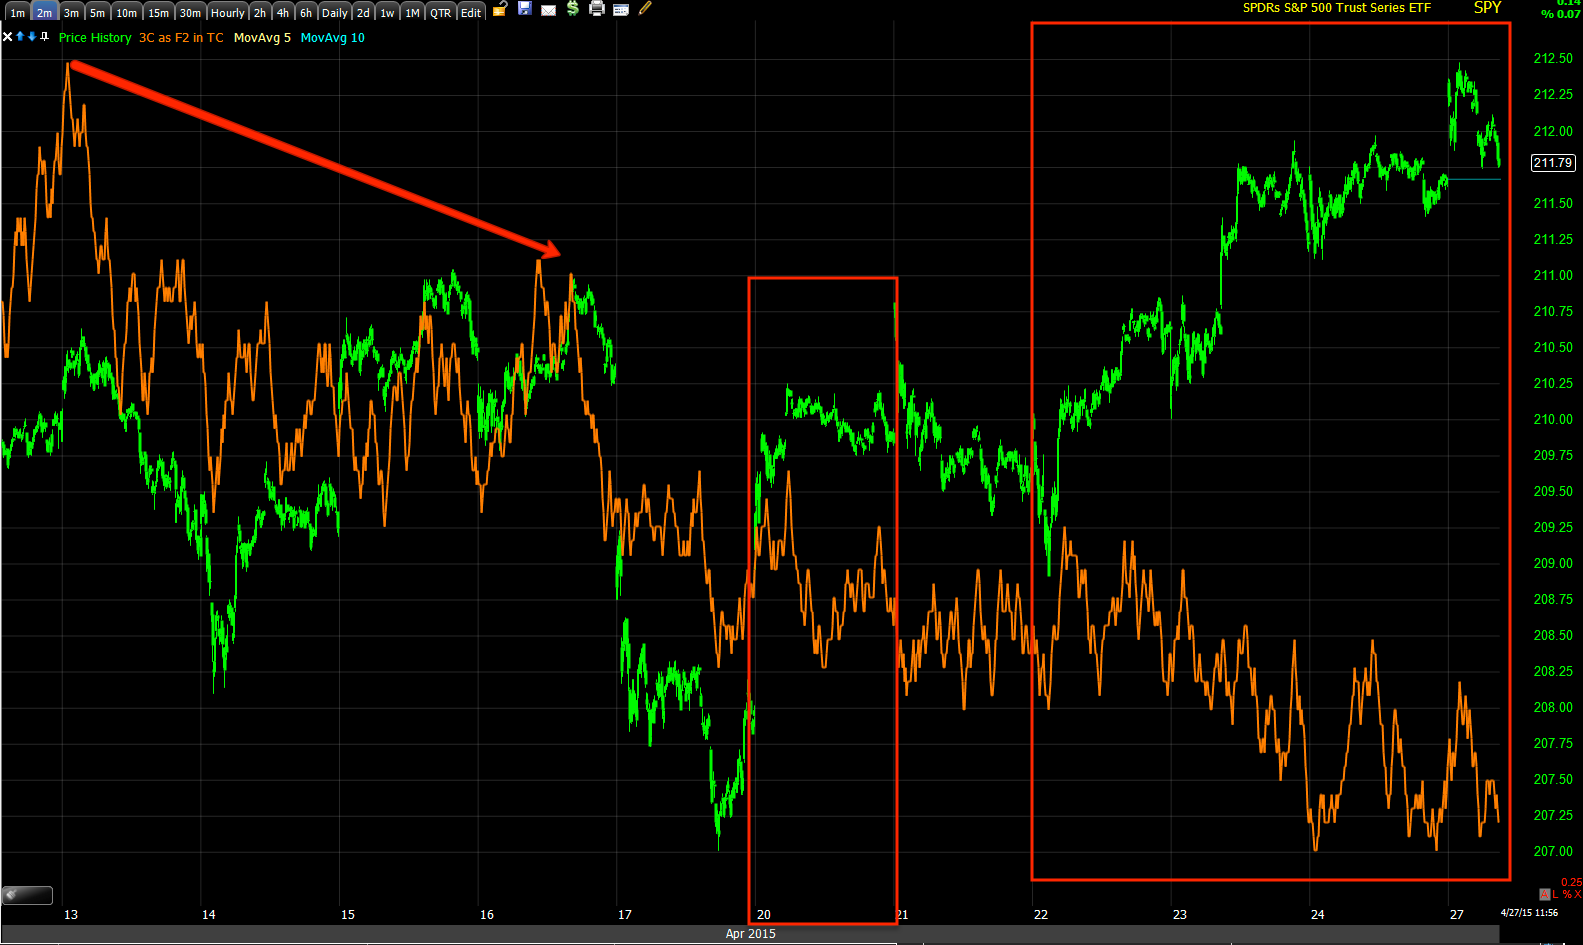
SPY 1 min looked like it was gathering some strength late Friday for a gap up, that was immediately sold this morning as you can see.
SPY 2 min trend speaks for itself. Remember some of the leading indicators I posted look to be almost a spitting image of this chart.
NYSE TICK Index (intraday)
Note the channel in the TICK index and what looks a lot like a Crazy Ivan with a move below the channel and then above the channel to +1325 followed by a move this morning to -1220. Volatility is rising near-term which is just as important as volatility rising on longer charts to nail the pivot.
My customTICK indicator showing a clear change in trend.


No comments:
Post a Comment