I have a theory as to what is actually going on and it is carry trade related, but I don't have the time to explain this theory before the minutes are released. To explain this theory requires numerous charts in numerous assets with numerous previous, historical examples.
Looking at index futures, the tone across multiple time frames is a very negative.
As an example, while I still haven't seen the 10 minute charts deteriorate like I would like to, they too show broad weakness.
Here's and example using SPY charts... You may wish to skim over them quickly
. The one minute charts aren't showing anything interesting. However when we look at the trends of these shorter-term charts, it becomes very clear. Remember hour divergence on May 6 and May 7 which represents the gas in the tank for the balance that has occurred since. This is why I want to see those 10 minute charts fall apart.
However the trend into higher prices is clear as is the message of the market.
SPY 2 min with the 7th to the far left. This is clear 3C distribution.
3 min chart is nearly identical.
The 10 minute chart with the initial divergence to power this bounce, has deteriorated significantly more this week, it's not quite where I'd like to see it yet.
SPY 30 min longer term
trend and much stronger underlying trend showing the same 3C distribution.
As well as the 60 minute chart.
VXX/ VIX short term futures are starting to looked very interesting today, I nearly put out a trade idea based on the charts below in VXX, I might not mind a VXX equity long, but for options, I want to make sure of the position and with the typical F_E_D knee-jerk move initially followed by the "real" response, I suspect I might find an entry somewhere between those events.
VXX 2 min which is something we saw yesterday that I chalked up to protection in front of the minutes.
However some of these charts are getting stronger like this five-minute
Or this 10 minute leading, but it is still two days .
VXX 15 min a lot stronger than yesterday
And the long term 60 min chart which makes perfect sense with the market deterioration above in SPY charts and index futures.
We talked about this in the past, the market reaction we'll set the initial interpretation or tone of information such as the minutes. This is why I think it is interesting that the $USD started showing a negative divergence for a near-term pull back. This Price action would cause the minutes to be taken as dovish. The thing is, the price action is immediate and sets the tone of the interpretation of the minutes long before anyone can actually read them. This could be very useful in covering/ closing the carry trade.
$USDX 7 min negative divergence is VERY clear, this has been set up in advance and a weak $USD on the release of the minutes will mean a dovish interpretation no matter what they say as price reaction is instantaneous.
The larger 30 min $USD divergence still suggests more of a counter trend bounce after some $USD volatility and likely downside.
This is a critical part of the carry trade closure.
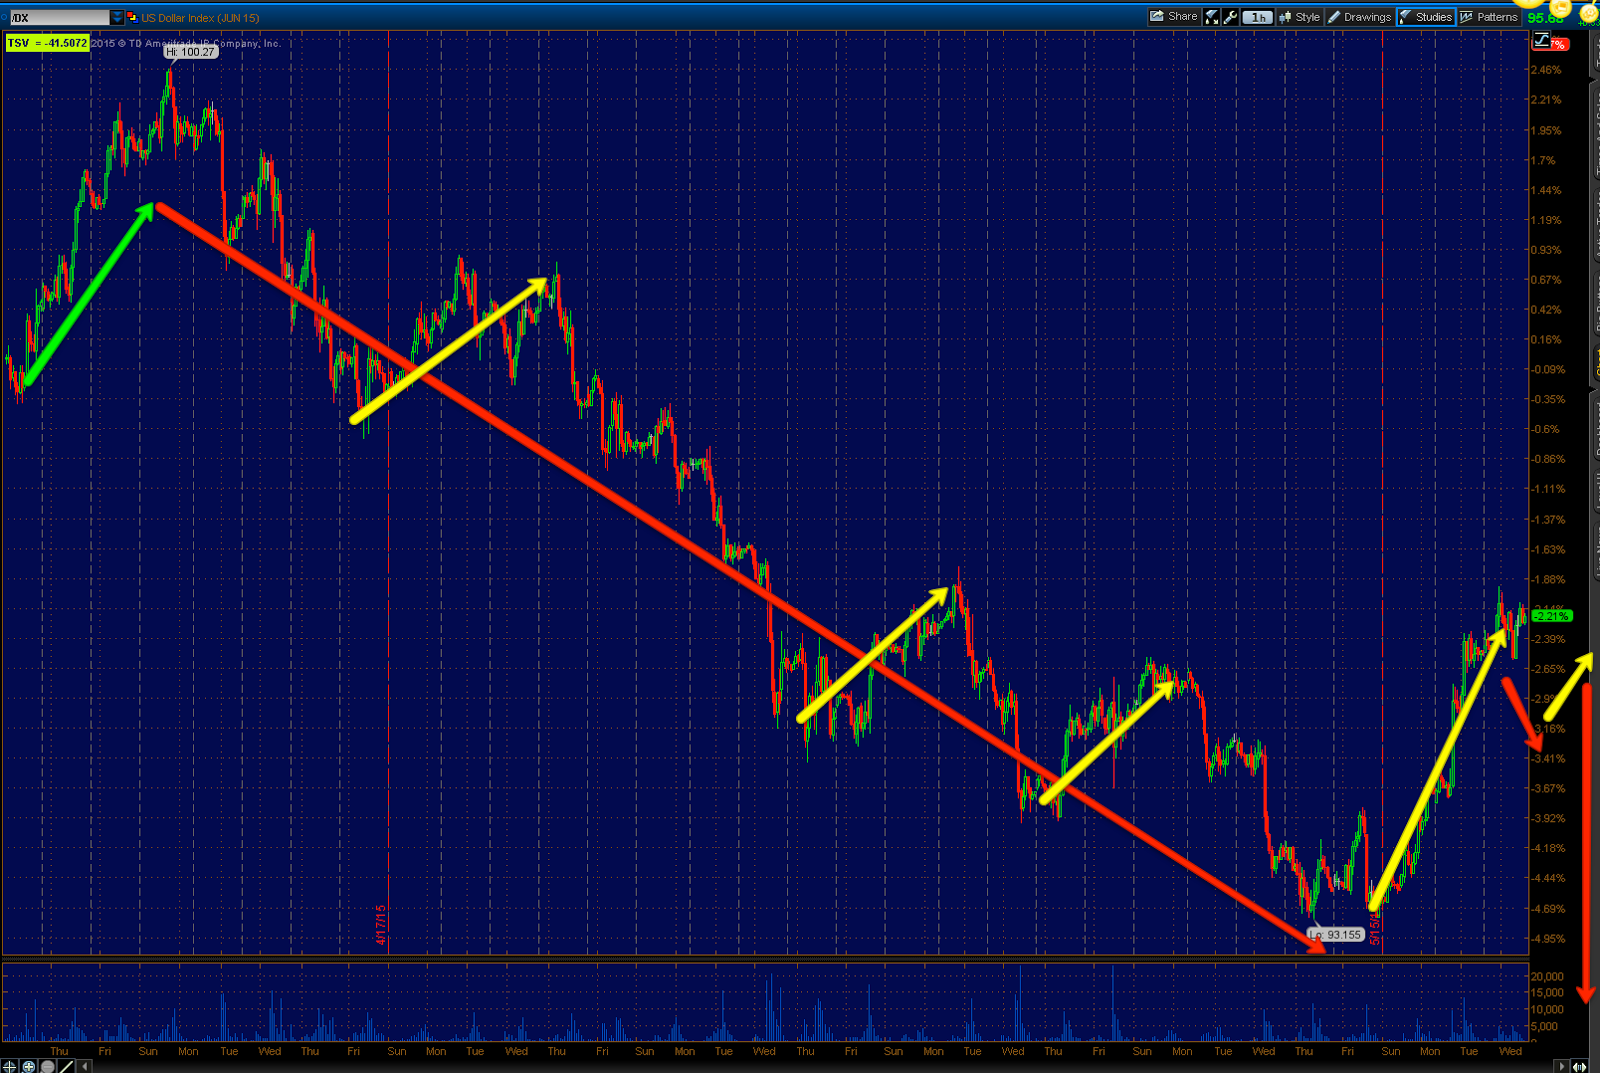
$USDX 60 min trend with counter trend bounces at the yellow arrows. As expected we are ready have a larger countertrend bounce than any of the previous ones and I don't think it is done. A higher USD makes it easier to Unwind the USD Carry trade without taking losses or as big of a loss. So I expect after a brief pullback as has been made clear the last day or so a move higher in the USD that will eventually be followed by a move to new trend lows.
I'll see after the minutes are released whether my theory holds water, if so there may be numerous trade ideas flying fast.


No comments:
Post a Comment