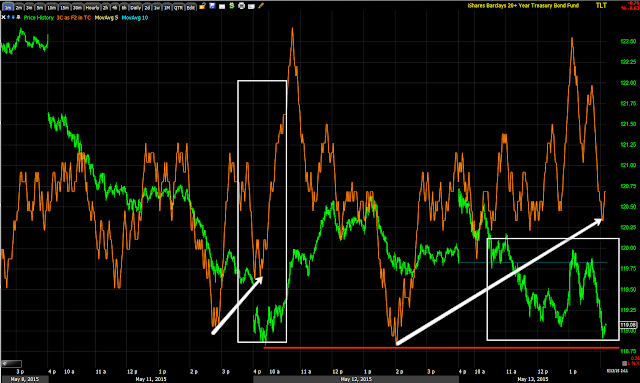
It looks like the TLT/long Treasury counter-trend rally trade set up is coming our way as it does what we were expecting and what it really needed to do to hold a counter trend rally which is by nature within a bear trend, but these are some of the strongest rallies you'll ever see, even if they fail at the end as they almost always do.
As a Quick reminder, here's the initial Trade Idea: Long Bonds / TLT from last week. We only took on a half size position because I suspected we would see a pullback and a wider base form where we could add the second half of the position, since then TLT/Treasuries have pulled back.
As noted last night, since Payrolls, the long bond has performed the worst and Treasuries are near their extreme end with regard to shorts which are very thick. Ironically the initial trade idea came because of a short trap set-up and grew from there, the head fake or Channel Buster concept.
There are a few concepts on this daily chart of TLT (20+ year Treasury). The first warning sign was the peeling away from the long term moving average or trendily, this is part of mark-up in which we see distribution, it's the period called "Excess" and although it looks bullish with the increased upside ROC, it is a warning sign that the trend is about to change.
We had 3C signals confirming the long term trend through almost all of 2014 until the end of the year when I noticed and posted that something significant had changed.
The break below the trendily is similar to why we don't short the initial break below the neckline of a H&S top, it's full of new technical shorts and Wall St. knows it and will use the opportunity to run them out of the trade with a strong counter trend move back above the trendily, that was the basis of the initial trade idea with more evidence gathered along the way. So I expect TLT to rally above the trendily on a counter trend move and eventually fail to a new lower low which I'll want to trade as well, just on the short side at that point.
Near term the base in TLT was too "V" shaped and not strong enough to hold a counter trend rally, thus the half size position last week and suspicion we'd see a move back down to form a wider "W" base that can hold the move, that's where we are now.
A closer look at the area on a 60 min chart with our partial position (white) and the expected pullback to at least the yellow trendily, but more is okay as long as we see accumulation on the pullback which will give us an idea as to when to enter.
Looking at Treasury futures just 10 minutes ago across the entire yield curve and through 5 different timeframes, I believe near term we still have some downside to go, but so far it has been a constructive pullback creating a larger base and a deeper bear trap.
The 1 min TLT chart shows where the partial (50%) position was entered in white on the 7th as I suspected a pullback to form a larger base, the next day on the gap up which I decided not to take the gains, but rather look at this as a longer term position, we had a clear negative divergence signal suggesting the pullback I suspected.
Since we have made something similar to a "W" bottom to the right with accumulation at the lows of the range, this is exactly the kind of confirmation we want to see in this situation.
A closer look at the same chart shows the intraday lows today have not broken below Monday's, I suspect that's why we still have futures calling for a little more downside. This will trip up stops as well as bring in new shorts and give TLT the fuel it needs for a strong counter trend rally.
Watch volume for signs of stops hit/ new shorts entering as we move below Monday's intraday lows.
The 2 min chart is seeing migration or strengthening of the positive divergence locally . Also note the change in price trend from down to more lateral as the positive divergences start showing. If you look at the range closely and examine the divergences, they are definitely trying to accumulate at the low end of the range and send prices lower as they start to rise by letting out some supply (second red arrow to the right).
The 5 min chart shows the much larger accumulation area with the 3C minimum target at the white box on the price axis around the $123.50 area, but that's minimum target, the entire point of a counter trend rally is to get traders to question the downtrend and to do that, they need to be spectacular.
We should have an entry soon for TLT /Treasuries long.
Is interest rates about to start going up?
-
Yes, I know - it does not make any sense - FED is about to cut
rates...but....real world interest rates are not always what FED wants it
to be.
6 years ago


No comments:
Post a Comment