I think sometimes we abandon the larger picture in an emotional panic for very short term jiggles in the market and lose good positioning, good gains and great opportunities.
Today on an intraday basis we have a small example of what I'm talking about. Yesterday during market hours I took several actions like closing QQQ puts, closing VXX calls, USO, etc. based on the price action and the probability of a 1-day oversold event and then I showed you leading indicators with one we haven't seen trigger in a while, our VIX inversion buy signal in yesterday's Daily Wrap.
Earlier today I even posted EXACTLY what to look for on a daily candle basis and in the 3C charts from last night's Daily Wrap, that excerpt can be found in today's earlier, Market Update***. At the time this was posted, EVERYTHING I was looking for last night for a reversal process on a 1-day oversold event was in place and then things went south today and probably caused a little panic...
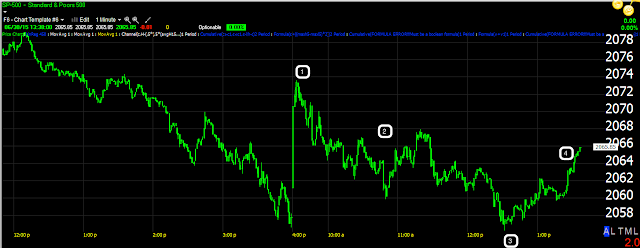
SPX intraday today looks ok at #1, looks good for our scenario at #2, but then looks like things may go wrong with a lower low and break down at number 3, then before you know it, we have an even stronger case by number 4. Watching the intraday trade too closely today might have led you to some emotional panicked actions that were not among our highest probability outcome.
As of now, we have an even stronger case for a reversal process and a short term oversold bounce.
The daily SPX 500 chart with a Doji daily candle today, also a Harami reversal as the candle's body is inside yesterday's or what is called an "Inside day" in western vernacular and thirdly, a "Tweezer" bottom reversal with yesterday's and today's intraday lows creating the bullish reversal candle pair called a Tweezer Bottom. In essence, we have an even stronger confirmation of the projection from yesterday.
As for the 3C charts which were the second part of what we'd be looking for today in addition to a candlestick reversal signal of which we now have 3 strong contenders...
That move to intraday lows gave us a stronger accumulation area on the 1 min intraday chart as you can see at the lows.
There's more migration of the divergence on the 2 min chart as well.
And migration on the 3 min chart which should be plain to the naked eye as it is jumping off the chart.
However we don't want to get emotionally carried away in the other direction either and keep the big picture in mind, the 3 min chart's trend...
And while the 5 min chart is seeing migration/strengthening of the short term positive divergence, along the lines of the reversal process and oversold bounce which I want to use to re-open new QQQ puts, VXX calls, and perhaps several others, the 5 min chart's trend remind us that any price strength on an oversold bounce should be used to sell in to or short into.
The basic point I'm trying to make is don't abandon your objective evidence too quickly because of some very short term movement that "seems" to go against it. In this case, it actually strengthen our case for an oversold bounce with all of the conditions we were looking for today and then some!
The market may crash to new lows if something big goes down in Greece, but unless you Technical chart reading skills include fortune telling, there's nothing you can do about that. We play the probabilities, as I said in this morning's A.M. Update-Default Day
"It will be tempting today to take positions in a bet or gamble based on rumors as to how this whole bonanza in Europe will turn out, perhaps a long position looking for a relief rally on some rumor. I WILL NOT BE ENTERING ANY POSITIONS WITHOUT EXCELLENT OBJECTIVE EVIDENCE. This is NOT a time, it's never a time, to make bets in the market, go to Las Vegas for that."
Is interest rates about to start going up?
-
Yes, I know - it does not make any sense - FED is about to cut
rates...but....real world interest rates are not always what FED wants it
to be.
6 years ago


No comments:
Post a Comment