The charts and excerpts/commentary below are all from last Friday's The Week Ahead post..
SPY 1 min intraday looks worse than yesterday. This does NOT look like it can support much if any bounce in to next week, so as I said, unless there's some additional short term base work put in, this market is looking dangerously close the the edge of the cliff.
The IWM intraday charts look like this, if anything I'd expect early weakness early next week as there's no confirmation at all here and it's not just this 1 chart.
...It's when the short term timing charts start falling apart that you need to be concerned (if you're long)...Again, unless there's some MAJOR work done early in the week, I think we'll be just taking what we can from the watch list of assets that are setting up on their own with no market support."
You saw yesterday's updates and while some 1 min charts showed some minor positive divergences as that is the weakest timeframe (with many run over), there was no migration to longer term charts such as 2 min, 3 min, 5 min etc. Thus there was no strength building. Yesterday's internals showed what I'd call a half-way short term oversold market. The Dominant Price/Volume /relationship among the comment stocks of the major averages was not flashing a 1-day oversold condition unlike the sector/group performance, that is something I suggested "may" happen today, or the market may just slice through the 100-day (SPX) and continue to a lower low as I expect will be the end result no matter whether a short term toe-hold, 1-day oversold condition or bounce can develop. The market needs to do some serious work to save itself from here was the point of Friday's post.
There have been some additional improvements that were obvious as early as the A.M. Update in which I showed some accumulation in the Index futures on a decline around 4-6 a.m. EDT today.
Here's what we have thus far that is showing some additional work / progress being made, although I would not call it anything slid as of yet. *I'll use the SPY as an example as it is close enough to act as a proxy for all of the averages (rather than post an additional 10 charts).
This is the trend of the 1 min chart since distribution sending it lower. There is a larger relative positive divergence , while a relative divergence is the weaker form vs. a leading divergence, the larger size of the divergence does count for something, although not much being it is only a 1 min chart so far.
The SPY 2 min chart shows 3C price/trend confirmation as 3C makes lower lows with price at the green arrows, however unlike yesterday, we do have some migration to a longer 2 min chart showing some improvement in the divergence and market.
The 3 min chart also shows the clear distribution sending it lower and 1 small divergence that saw distribution and now a relative positive divergence, although it is the weaker form, it is starting to see what it did not yesterday and that is migration through longer timeframes indicating some strength building, although still very early.
Interestingly the 5 min chart which is much stronger than the 1-3 min charts even though it doesn't seem too far removed from them, shows the clear leading negative divergence/distribution sending the SPY lower and a relative positive divergences today as well. So today we do have some migration, although it's more of a start of improvement rather than the beginning of something I would consider high probability.
The 10 min SPY is still in perfect downside confirmation as this is a stronger timeframe and 3C trend of underlying flow.
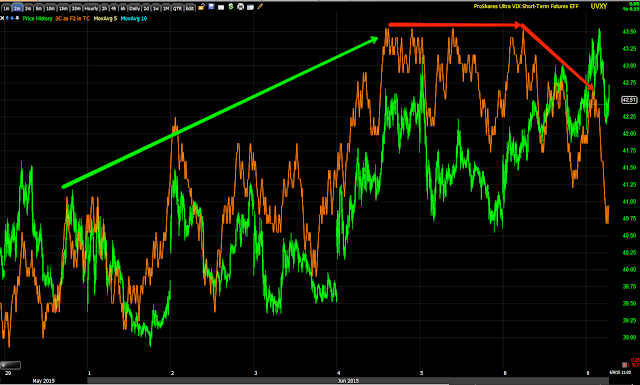
VXX/VIX short term futures trade opposite the market, which is why we opened a UVXY position to add to the already open VXX partial position last Thursday, Trade Idea: VXX / UVXY Long.
VXX 2 min is showing a confirming negative divergence suggesting there's something to the building SPY divergence above.
UVXY, the 2x leveraged long ETF-(VIX short term futures) is also showing the same 2 min negative divergence and confirming both VXX above and SPY above as some market strength is starting to take hold.
However, I would not confuse any potential market strength no matter how much it builds from here with a market reversal that will stick if we even get to a bounce. This 10 min (and 15 min) VXX chart is in a leading positive divergence with a large base/accumulation area (in the form of an ascending triangle).
In addition to the short term SPY/VXX charts above, as mentioned several times already, there's only 1 reason to see a positive divergence in High Yield Credit and that is as a lever to help move the market. We saw this yesterday, however keep in mind that no matter what we see in HYG short term, there's no coming back from the larger trend which must be considered in any analysis from this point froward, What High Yield credit is Screaming
HYG 1 min showing additional and interesting leading positive 3C signals intraday. It would seem someone is trying to put some support below the market in the area. As I said Friday, the ,market has some serious work to do if it is going to bounce as it looks dangerously close to falling off the edge of a cliff, some may say that has already happened with the SPX breaking the 100-day, bit as we know, many traders will be focussed on the SPX 100-day m.a. which sets up a perfect area for Wall St. to game main-street, although I have little doubt how all of this resolves as the games and short term action fades away.


No comments:
Post a Comment