It appears to me from the charts below that USO which I fully expect to build a larger base, just put in a counter rend move. Oddly with the $USD down as it is today, you'd normally expect oil to not be putting in negative divergences.
the one thing that comes to mind is perhaps leaked API inventory data out after the bell today poor tomorrow morning's EIA inventories for crude...
Most of the charts are obvious enough that they don't require any notation.
USO's daily chart/base. I've expected USO/Oil to come back down inside the base and finish building it out and then moving to a reversal of trend and back to an uptrend off this base.
USO has been trending lower back inside the base as you can see by the clear channel, maybe a bit too clear. The run at the yellow arrow looks like a counter trend mover and the break above the channel would suck in longs and squeeze shorts, using the predictability of the price pattern against traders.
The USO charts below are consistent in their divergences,
however the really nice trade will be when USO pulls back and we see strong positive divergence building, that should be the entry for the intermediate or primary uptrend.
USO 1 min
2 min
3 min
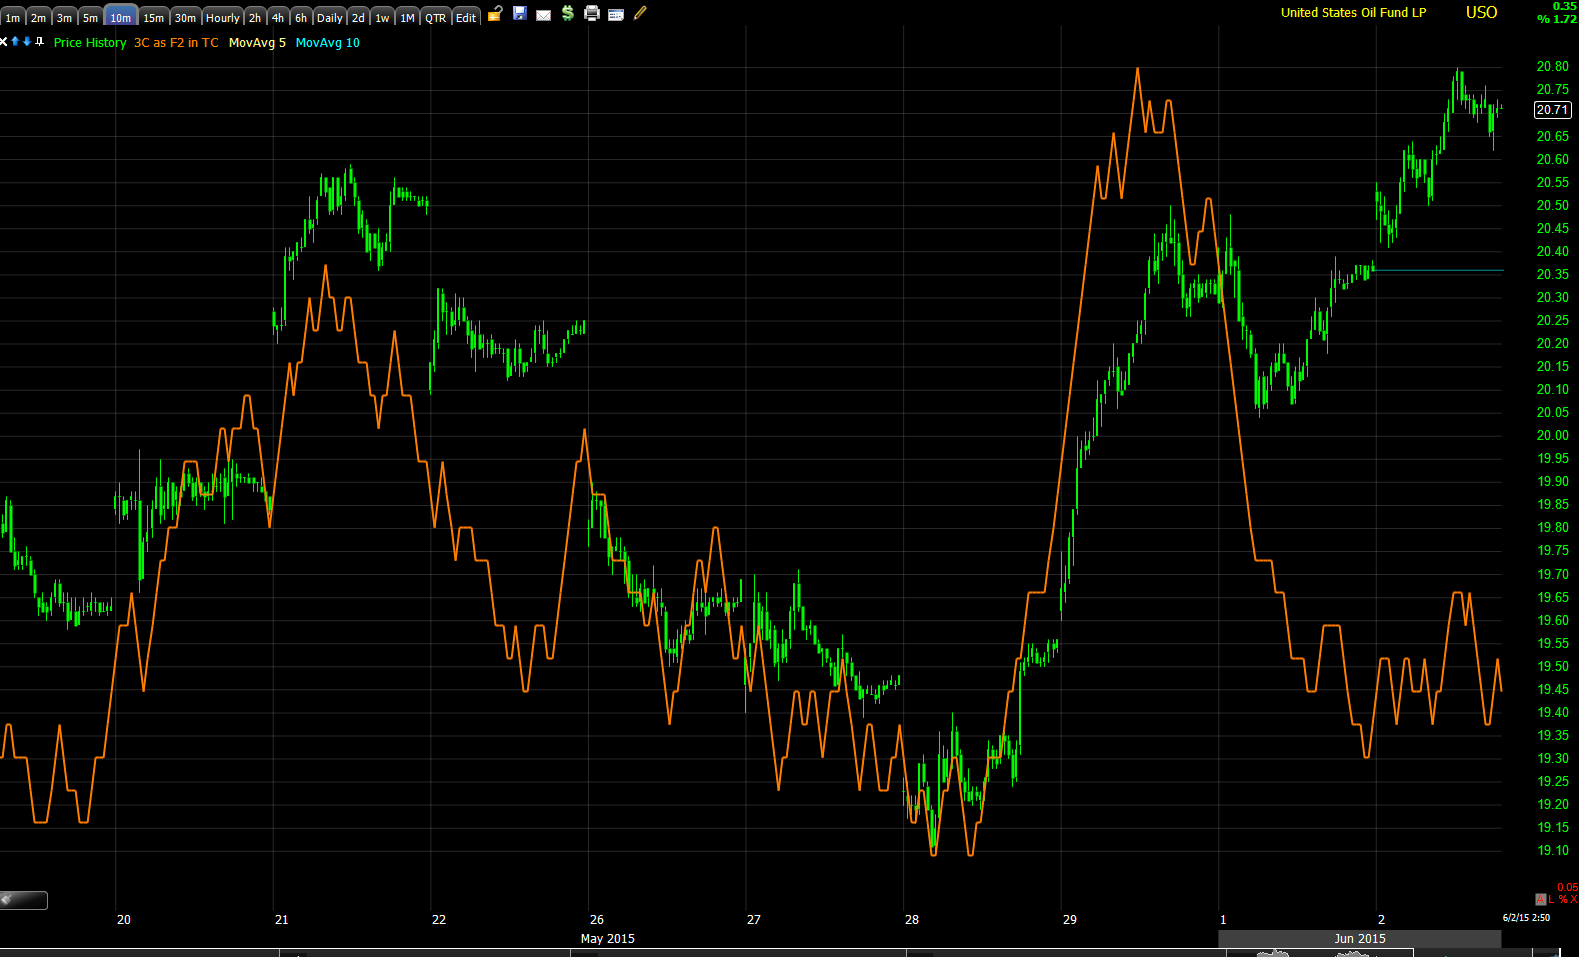
10 min
15 min with red hash marks showing the trend lower back in to the base.
I went through all of the timeframes today in Index Futures, the $USDX, Euro, Yen, Gold, Treasuries and Crude. The most consistent divergences through the most timeframes without interruption was Crude futures, negative but in the short to intermediate ones I'd expect for an asset that is building a stage 1 primary base.
CL 1 min
CL 3 min
CL 5 min
CL 10 min which I think shows the nature of a counter trend bounce's underlying trade very well.
CL 4 hour


No comments:
Post a Comment