Welcome to the complicated AAPL chart. Over the last year there have been some big fund managers completely cashing out of AAPL positions and I do like AAPL as a longer term core short which is over a period of a year or more within a trend we really haven't quite entered convincingly anyway, the SPX break of its 200-day moving average would be a big boost to the transition to a stage 4 primary trend and everything seems to point in that direction. However as you may have noticed I haven't put out any recent AAPL trade ideas.
I'll show you what I like about AAPL and what makes me a bit nervous as AAPL reports tonight, but first a little rant that applies to everyone, AAPL trader or not.
I don't really care whether AAPL beats or misses, I don't think the market (or at least the pros) do either. The fact of the matter is that if the broad market averages are down, about 66% of stocks-you pick em, are going to be down. It doesn't really matter if it's a great company or a turd with a ticker. When the die comes in it lifts all boats and EVERYONE is a market genius, although that's not really true (market genius), it's just the simple truth of a rising tide lifts all boats and an ebb tide does the opposite. Remember all of those Mutual Fund/401ks back in the day and people would make a boat load of money in these mostly long only funds until a bear market came and erased all the gains and people would panic and sell at the bottom and then brag about how much money they lost at a cocktail party. That's just the truth of the market. If the major averages are moving in one direction, the majority of stocks are doing the same and it has almost nothing to do with the individual stock in most cases.
AAPL has already been COMPLETELY sold by some very large funds, COMPLETELY. So do earnings really matter to me that much beyond a very near term trade or position? No, and I don't think they'll matter to the market either in the bigger picture.
Now as to what I like and what I don't like and at the end you can se if you can guess what my trade plan is beyond a longer term core short AAPL position that we've had for a while, but absolutely NO recent AAPL calls.
This daily chart of AAPL transitioning from a stage 2 uptrend to a stage 3 top is a chart I like. Note how the former uptrend has transitioned lateral to make a large ascending triangle. Triangles this large are not consolidation / continuation patterns, but that doesn't stop lazy technical traders from believing that and Wall St. knows it. Most often these are tops or bottoms depending on the preceding trend, in this case it would be a top.
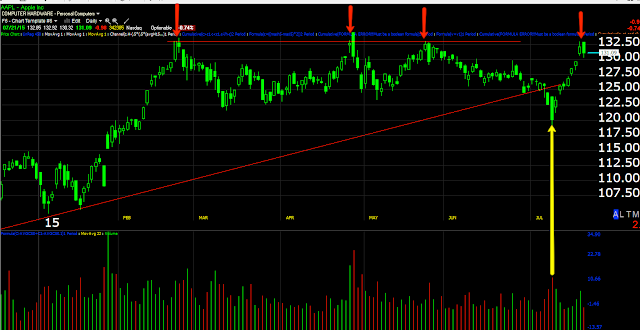
This Daily chart of AAPL, which is the same as above, just a closer look at the most recent trade is a chart I do NOT like. Can you tell why? Think about the NDX charts from earlier today as to why the NDX outperformed the other averages even though it had some of the worst breadth with only a handful of stocks leading it higher due to its odd proprietary weighting schedule. You can pay $10k a year for a NASDAQ subscription and get the weighting schedule, but in the past, when AAPL was the big component in the NDX, it was worth approx. 20% of the average's weight meaning that it was worth about the same by itself as the bottom 50 weighted NASDAQ stocks combined. If you took those bottom 50 NDX 100 weighted stocks and threw in AAPL and all 50 of the stocks were down 2% cumulatively on the day and AAPL was up 2.5% on the day, the NDX 51 would close up +.50% even though 50 of 51 stocks closed down 2%.
Also note the head fake below the triangle at the yellow row with large volume as stops were taken out. Once again, head fake moves tend to be some of the best price-based timing indications we have and this one was purposeful in hitting stops under the obvious tringle and the psych level of $125.
In a channel buster or Crazy Ivan situation which is what this looks like, what is the most probable outcome with AAPL having broken below the support level and moved back above?
If you said a Crazy Ivan breakout/head fake ABOVE the very clear resistance area, you'd be right. Thus, near term, I'm not crazy about this AAPL chart and an AAPL (new) short position ...YET
I do like this 1 day 3C chart of AAPL showing the 4 stages of a cycle from stage 1 accumulation on a double bottom to stage 2 mark-up and stage 3 top/distribution. However, in a stage 3 top such as the one in yellow, what is the most likely price-based timing indication telling us AAPL is ready to make a serious move lower?
If you said a head fake above the resistance area just like we saw in the NDX over the last week, you'd be exactly right.
The AAPL 60 min chart which is not as strong as the daily chart above, but more detailed and more immediate in its signals. Note the distribution with AAPL coming down and that move down was the one that broke BELOW the triangle or set up the stop run head fake pointed out above, giving AAPL short squeeze momentum, then long chasers momentum. Note the accumulation of the stops at the head fake which can be seen more clearly on the daily chart above. In addition the 60 min chart is still in line since this move.
Coming back around to the shortest timeframes and working out as all new divergence start on the earliest timeframe and we are looking for a reversal of the 60 min chart, the 1 min chart shows a small head fake yesterday and leading negative today, but this is only a 1 min chart, the weakest underlying trade there is.
I like the 3 min chart, it looks pretty clear that tAAPL has been sold in to higher prices and later I'll give you some proof of that, beyond our charts.
However at the 30 min chart which shows the head fake below the triangle in yellow with accumulation of the stopped out shares, we have a relative negative divergence. This needs to be stronger and then it will migrate to the 60 min chart and take care of that troublesome chart, but in the meantime, until then, I suspect whether earnings are great or stick the joint out, they are going to try to lift AAPL above the daily chart's range as that's where there will be demand and the best AAPL exit for remaining long shares in large institutional accounts.
So, how would you play AAPL knowing what you see above?
My thought is, "I might miss the trade with the market getting as ugly as it is, but I think the highest probability for AAPL is a break above that very obvious resistance zone just like the NASDAQ-almost a carbon copy and that's where we'll get the best signals and head fake with the best entry and lowest risk.
That's where I think the highest probabilities are and that's what I'll look for unless something changes between now and then. By the way, failed breakouts see some of the fastest/sharpest reversals to the downside so an entry on a head fake move is not only well timed and excellent positioning, but leas to a failed move produces a fast reversal.


No comments:
Post a Comment