Perhaps the F_O_M_C is an influence in today's market activity, but perhaps its not in the way I initially wondered about. Perhaps this is exactly the bounce we were looking for, it's the right kind of move and at the right time and once you see the charts below, it may have the right confirmation to fulfill the expectations of exactly what we thought it ow;ld be Friday and yesterday.
I'm going to post numerous charts in various timeframes, this morning's decline looks to have been accumulated with some very interesting moves in 10 and 15 min charts intraday.
There are some strange non-confirmation signals in the Index futures and Currency futures at this moment, they can move pretty quickly, but I'd say as of this moment, there's a divergence in the charts between the averages and Index futures and the Carry pairs or at least USD/JPY.
QQQ
2 min
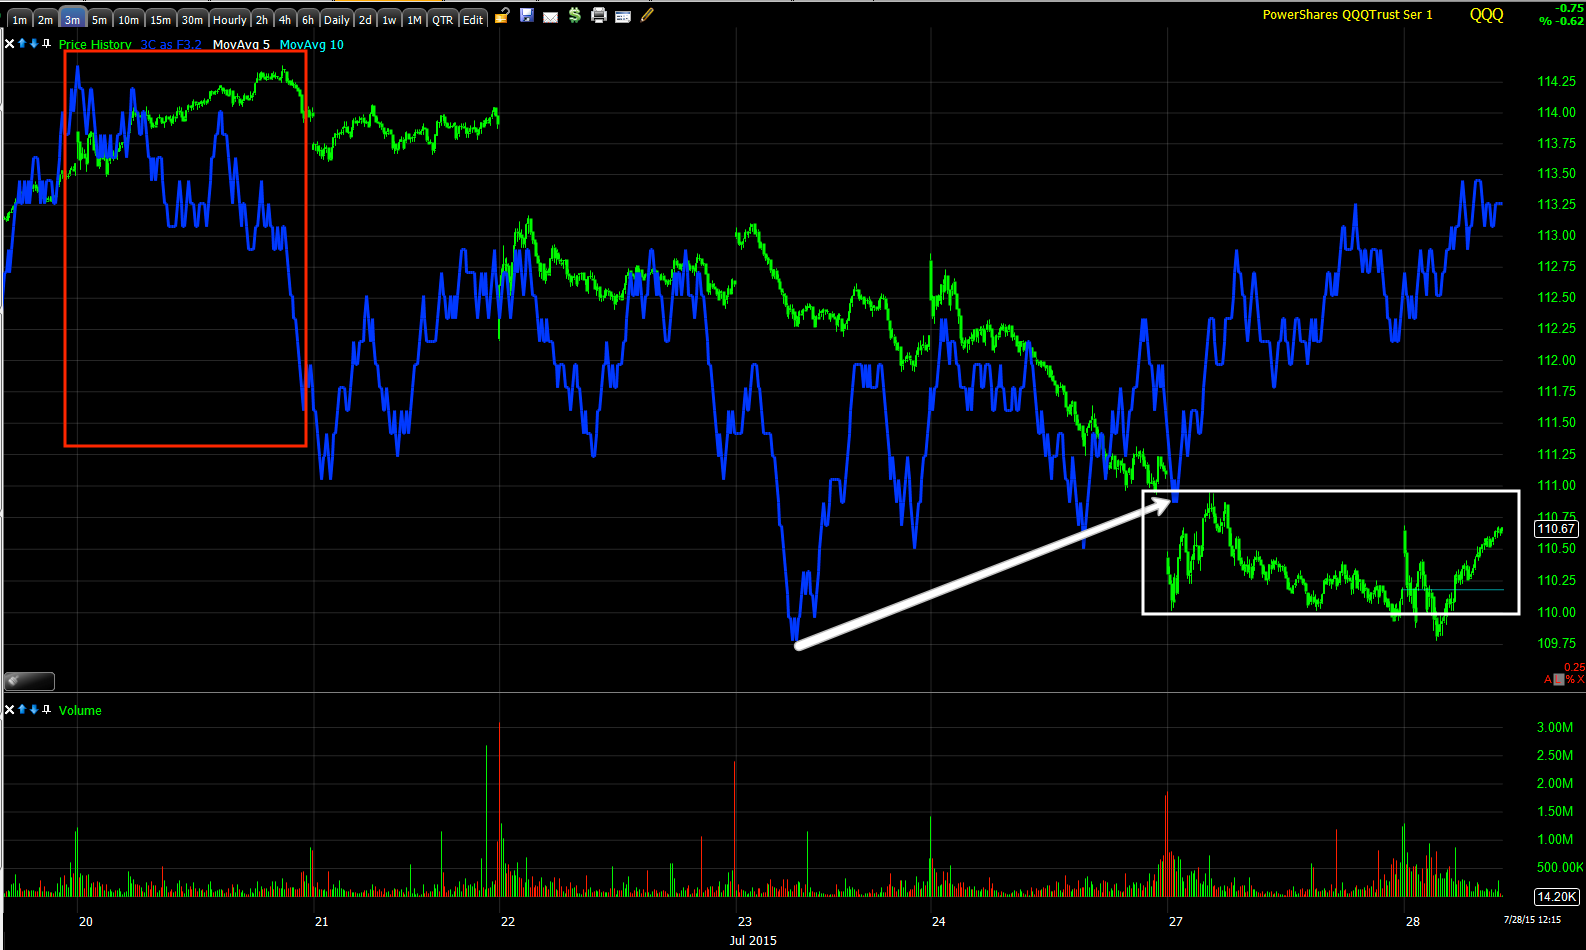
3 min
5 min
10 min with a sharp intraday move
10 min with some context from the last bounce/cycle
IWM
3 min-again this is the move I was thinking may happen yesterday and why I liked the idea of leaving some room in the IWM position to possibly add to if circumstances start looking better.
5 min with another big leading 3C signal intraday which is somewhat unusual on a chart like this with timeframes 5 min and longer.
10 min with another sharp 3C move higher today, it's the volume/head fake.
And the same at a 15 min chart.
The IWM trend is provided for some context, (30 min), so while what we have right now is getting more interesting, it's still not something that really even sits at the same table as this later underlying trend.
SPY
2 min
3 min
5 min with the last bounce cycle's stage 3 top.
SPY 5 min trend within some longer term trend context. It's easy to get lost in the lines with big intraday moves and forget what the long term underlying trend is.
SPY 15 min which saw most of its movement today . I put a "C" at what looks like a hot term capitulation event which we marked as it happened and "A" where it looks like the early selling today was accumulated.
SPY 30 min with some context with a positive divergence at the last stage 1 base area before the bounce started, stage 2 mark-up, stage 3 top and 4=decline.
The custom TICK indicator shows the deeper mini capitulation event to the left and you see improvement through yesterday with an obvious change in character today with price.
The same chart from the start of the last cycle with a larger capitulation/short term selling event at 1, improvement in to stage 1 of the base at 2 and then 3, then the deterioration I kept pointing out at 4 and what looks like another, but much smaller short term mini capitulation event this early yesterday and late Friday.
Picking up from yesterday's
VXX /UVXY Update post...
UVXY 1 min which is not anything unusual that we didn't know yesterday. The small positive divergence is in line with the 1 min negative divergences in the averages intraday I posted earlier.
VXX 2 min essentially the same thing we knew yesterday but more in line on the downside than negative leading as you might expect given the market averages above.
VXX 3 min, again pretty much the same thing from yesterday, no real news here today. I'd say Short term VIX futures are holding up better than I'd expect based on the market averages above. Perhaps they are going for the bounce off yesterday's reversal signals and trying to get it out of the way and over before 2 pm tomorrow when the F_O_M_C comes out...
5 min with a perfectly sensible, reasonable large positive divergence that correlates well to the bigger market picture and what happens after this bounce fails.
As for futures, I'd normally never enter a long for a bounce like this without at least the 5 min charts in line with a supporting positive divergence.
That's what we're missing from anything bigger in the market on the upside and what makes me think there's probably nothing more to this than what we expected yesterday, a bounce and any counter trend bounce has to be impressive. Remember the comment from yesterday's
Daily Wrap...
"...the retail crowd have already flipped sentiment from "Buy the Dip" Friday to bearish today. The market seems to do a great job of making the largest number of people WRONG at any given time."
That's exactly what today does and perhaps it does need to get done before the F_O_M_C tomorrow which would be in line with the The Week Ahead forecast from last Friday:
"There are numerous smaller indications that make me think we either open higher early next week or we try to put in more of a base for a bounce, but I mean bounce in the most nearly meaningless way, nothing I would trade (other than a speculative position) and nothing that would make me think that our course is going to be interrupted by anything more than some short term noise if that."
In any case, note the differences in Index futures except intraday, there they are showing distribution in to higher prices just as the earlier negative 1 min divergence I posted.
ES 1 min positive yesterday in to the afternoon to the far left, up overnight on USD/JPY strength as we expected with a negative divergence coming in to the US cash open and a positive divergence at the a.m. low and bounce that again has no confirmation which looks like the other intraday charts so it looks less like a larger base will be built and more like these higher prices are being sold in to,
which is the scenario we've expected since Friday and all yesterday.
TF 3 min doesn't even have a positive divergence (Russell 2000 futures) so the usually 5 min prerequisite is not even close.
ES/SPX E-mini futures 5 min perfectly in line with the trend, no divergences whatsoever,
certainly no positive that would be the prerequisite (for me) for a full size trade (anything larger than speculative).
The NQ/NASDAQ 100 futures also shows nothing but a negative divergence at the bounce top and in line/confirmation of the move lower, no positives.
ES 10 min which is about where we look for trends. You can see the negative at the top of the bounce cycle and then leading negative to the downside. I did mention that price catching down to 3C in the green area makes it easier to get a short term bounce on the fast timeframes, we have the bounce, but no supportive divergences whatsoever which makes me believe it is as we expected initially.
YM/Dow Futures 30 min also negative at the bounce cycle's stage 3 top and in line on the downside.
TF /Russell 2000 futures 60 min with a worse negative divergence at the most recent bounce and in line with out bigger picture expectations.
I don't see anything in the $USDX or Yen like I did Friday and yesterday that would suggest it will lead the market higher as it did overnight, it appears that's all we get. I do see Yen futures in more serious timeframes with positive signals which would be negative for USD/JPY and by extension likely the market.
I'm going to be looking for any signs of additional weakness building through intraday charts and/or accumulation in VXX/UVXY . I suspect this is our bounce.


No comments:
Post a Comment