This morning's
A.M.. UPDATE gave us an early preview of what happened to any kind of overnight price gains. Excerpts below...
However we already see some weakness in Index futures from the overnight session in 3C such as this 1 min ES chart.
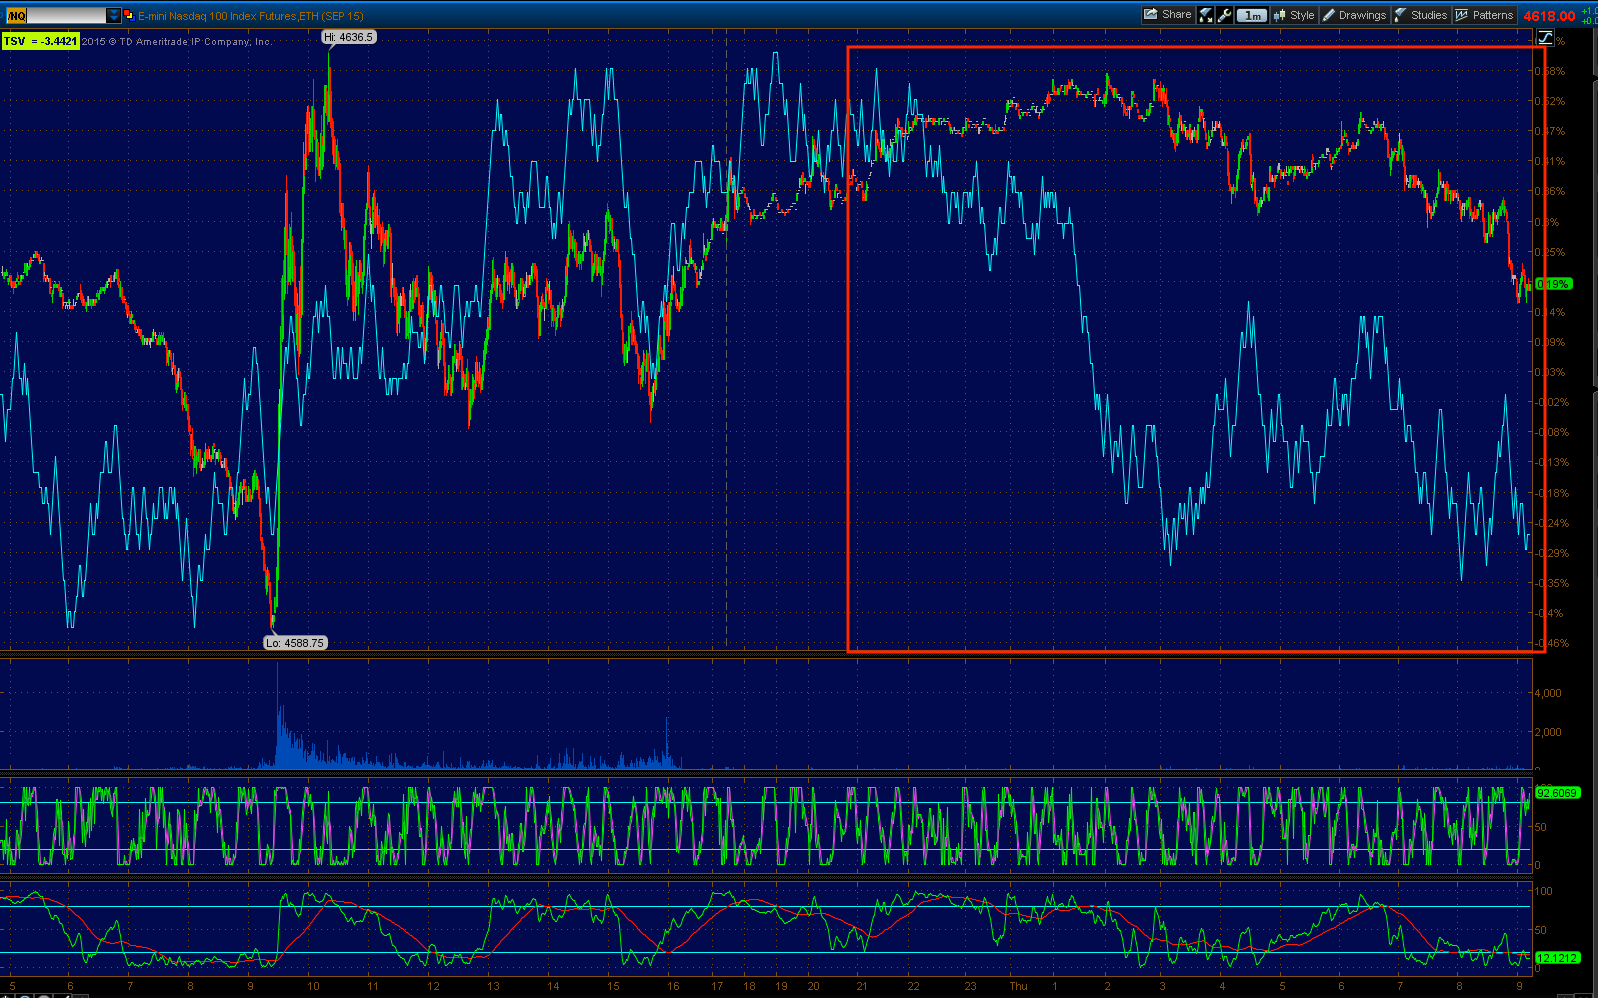
1 min NQ
1 min TF also showing 3C weakness in to the overnight session so I suspect the bounce or higher prices are already being aggressively sold in to, the same game plan we have, institutional money just has much larger positions and has a lot more selling/short selling to do."
As for Treasuries/Yields acting as a leading indicator, for the time being they sure are.
2 min TLT with a slight negative divergence end of day.
The 1 min chart shows it better, but right now it's price action in Treasuries that matter sending yields lower and that tends to draw equities toward yields like a magnet.
30 year Yield Trend (red) vs the SPX (green), that answers any questions about yields still acting as a leading indicator.
Just because a lot of what I was trying to do today was say, "If there's a bounce, that's okay and maybe it opens up some trade entries, but don't forget what the big picture is all about as that's where the highest probability, longest/strongest trades area"
In that spirit, this is the bounce's cycle with stage 1 accumulation, stage 2 mark-up, stage 3 distribution/top with a head fake at the yellow box and stage 4 decline on a 5 min chart. Yields led the market early in the bounce to the upside, then diverged and led the market to the downside. The interesting thing is we knew this was going to be the outcome before the bounce even started, but that's not a guess, it's not a prediction, it's based on objective evidence.
However for the time, please remember the 1 min TLT chart's intraday negative divergence above.
Every form of risk asset was more or less sold off, equities, commodities , yields. All market averages are lower on the week. THIS IS EXACTLY WHAT WE EXPECTED LAST FRIDAY IN THE The Week Ahead POST:
I'm fine carrying some downside positions in to next week, including Trade Ideas from this week including FAZ (3x short Financials), SRTY (3x short Russell 2000), UVXY (32x long Short Term VIX futures), SQQQ (3x Short QQQ), QQQ 8/21 $112 Puts, BIS (2x short NASDAQ Bio-Techs).
The USD/JPY (edit) which as a carry cross has sponsored this week's bounce along with HYG, some VIX smack-downs, is clearly looking to make a downside reversal....While the USD/JPY looks to be in line as the momentum of the bounce in everything other than the NDX has turned lateral to down, the $USDX and Yen futures are pointing to a clear change next week. I've gone through 9 different timeframes for each futures so it's impossible for me to get them all out, but these are some examples of strong timeframes and divergences that should lead trade next week to the downside....As for Index futures, it looks to me they need about a half a day to finish up, although that's a pretty specific prediction, but the charts are clearly negative.
Thus there's excellent confirmation between FX, Equities, Treasuries and VIX futures. I suspect we have some time early in the week to add additional positions, but I'm also very comfortable going in to the weekend already holding significant positions. If we can add additional positions Monday, I'd do so, I don't think anything is going to change these charts which are far beyond intraday.
Otherwise, I suspect (edit) with head fakes in, we are at the pivot to a downside move that eventually slices through the SPX 200 dma
It turns out that Monday was the head fake move expected last Friday before the market turned down.
SPX daily chart with some strength Monday followed by the downtrend expected as of last Friday the rest of the week thus far.
The major averages today with Transports seeing their worst performance since January with the overall Dow Theory dislocation between the formerly high-flying Transports and the Dow Industrials being at a very red flag divergence.
Dow Industrials vs Dow Transports going from strong momentum in Transports to a decline in momentum to an outright decline and divergence with Industrials which has been a Dow theory red flag for nearly a century. The basic premise being, if the industrials make products, then the transports that ship them should look similar, but the are far from similar as the histogram above shows.
As for the closing charts today, tomorrow is an weekly options expiration which if we got a bounce, I suspected would be about either a gap fill if it happened earlier or as I mentioned a couple of days ago, we could still see a bounce from lower levels, more in line with an op-ex max pain pin.
Remember the 1 min TLT chart I asked you to remember above with a negative intraday divergence.
The DIA ended the day with a positive divergence after earlier ugliness.
However putting that divergence in perspective of the DIA's 1 min trend shows it not to be much to be excited about, or at least not to be looking for a long position with what we have right now.
The 60 min DIA chart which is far stronger and represents the highest probabilities is shown here with the 4 stages of the bounce, these are stages marked by price, not 3C divergence although 3C can help identify them.
The SPY 3 min has a positive divergence since last week's negative that has remained pretty much in line to the downside.
And the SPY 5 min chart which was mildly supportive of a bounce has fallen in line with the downtrend in price, actually leading it lower.
And the SPY 30 min big picture with the 4 different stages labelled just for reference.
IWM 1 min positive divergence after this morning's non-confirmation and downside.
Again to keep the big picture in perspective the 60 min IWM chart labelled with the 4 stages for reference . The previous negative divergence is what I believe to be the top in the IWM.
QQQ 1 min positive in to the close, again only on a 1 min chart so if anything, this may be a push higher for Friday Options expiration, certainly nothing I would trade long, but perhaps an opportunity to add to positions.
And the 60 min QQQ with the bounce cycle for reference leading negative.
As sort of confirmation the VXX 1 min chart shows a 2 min negative divergence, remember these are 1 min divergences even in TLT, they are very weak, but can bounce the market, especially in to an op-ex pin or they can be used as support to hold the market in an area, they are not anything I would consider to be any kind of upside threat.
And the VXX 5 min chart just for some perspective in a strong leading positive divergence, I covered VIX futures in a separate post earlier today, you can see it here, Perspective: VXX / UVXY
Thus there looks to be a decent chance for some kind of bounce in to tomorrow's op-ex for a max pain pin, although typically Friday's open right around (and pin) the Thursday close.
I don't see much more than that.
In leading indicators...
SPX:RUT Inversion, not as strong looking as yesterday, but still in better condition than it has been and in position to be mildly supportive of some market upside or at least a pin in place.
Pro Sentiment has been moving to the downside which is no surprise as we have seen any price strength sold in to just like overnight futures.
This is the longer term view of Pro Sentiment turning negative at the SPX May head fake highs and leading negative ever since except for a brief divergence at the base for the July 10th bounce,
HYG was largely in line with the SPX today.
After confirming the downside, HYG has a small 3 min positive divergence in place and has been moving laterally rather than down, it's set to either support a bounce if it moves higher or give the market consolidation support in the area.
Here's a slightly longer intraday view of HYG vs the SPX, note the more lateral trend.
However don't expect much and don't expect anything that develops to hold. This is HYG's 5 min chart/trend leading negative through the bounce cycle.
And here's the primary trend. About 2 weeks ago I said it would be moving toward making anew lower low and it's not far off.
As the saying goes, "HY Credit leads, stocks follow", that doesn't bode well for the market .
HY Credit making another lower low today in the latest bounce cycle.
And longer term since the May SPX head fake.
As far as futures, I usually require that the 5 min charts be divergent in the direction of new trades, for instance leading negative which ensures I'm not chasing price lower and I'm not about to see a bounce in which I don't want to open a new short for timing reasons. Right now these are mostly in line so I'll be looking for a leading negative divergence otherwise, I'm more than content to let previous shorts set up over the last week or two, work.
Futures also shows the probability of 30 year Treasuries coming down very short term which is the same thing I asked you to remember about the TLT charts as that would send yields higher and act as market support.
Nothing has changed about Yen futures which look like they could pullback for a stronger base, in the process of doing that, USD/JPY would give short term support for the market, but other than some random signals here and there, the strongest signals are in the longer timeframes for USD/JPY and market downside. We'll see if they improve tomorrow morning.
Overall I'd say the same trade plan remains in effect, let shorts we opened in anticipation of this week's move down and beyond, work. If we get a bounce that makes sense and offers a discount and lower risk, we'll take advantage of that, but right now beyond the very short term and weak signals above, the clear , strongest trend is for the bounce from July 10th to continue in its stage 4 decline, eventually breaking the SPX's 200-day moving average and at that point, all bets are off as sentiment among retail remains very high.
Have a great night!


No comments:
Post a Comment