This has been the main sticking point we've seen this year impeding the F_E_D from a rate hike, low inflation. They've even reduced the bar as I mentioned yesterday to not actually needing inflation to begin hiking, but "Feeling" comfortable that inflation is on target to move to their long-run average of 2%.
So even with built in work-arounds, inflation still remains stubbornly low which is what I was concerned with near term for Gold as gold is typically bought on inflation concerns, before actual inflation.
In any case, something is bothering me about the market here, it feels like churning and we can burn through the "gas" in those charts pretty quick if we are churning.
I used the closest timeframe to the market reaction since the F_O_M_C on the SPY- 15 min and to me it looks a lot like churning.
Although this is a pretty common initial reaction, it can certainly facilitate churning, the handing off of shares from strong hands to weak hands.
I decided after going through the charts, I'm going to look for the best exit for the IWM call position and then I may enter a new short position or perhaps a long VXX / Call position.
Speaking of which, there's a divergence between XIV which is the inverse of VXX (short term VIX futures) and VXX...
XIV above should look better than it does.
The 1 min SPY tells me it's probable that I can get some more juice out of the market on the upside, but I don't think that the trend of the last 2-days has abated, that is steady distribution in to higher prices.
Beyond that looking at the larger trend of just what I described above, the SPY 5 min chart is a perfect example.
as for Futures reaction...
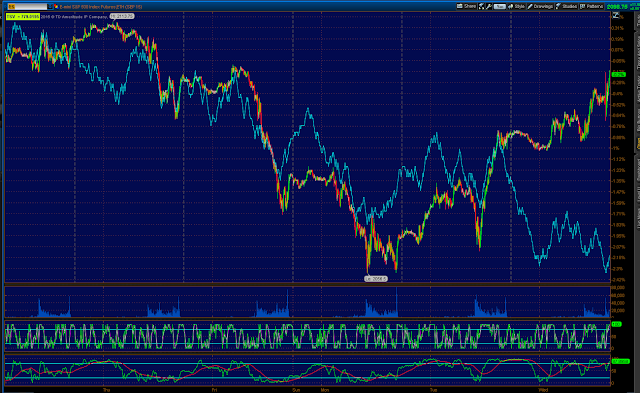
ES intraday 1 min did not react well to the F_O_M_C as it's in leading negative position intraday.
The Russell 2000 futures have been in negative position all day, the point is at the F_O_M_C there was no positive change in their reaction.
The $USDX has a negative intraday divergence and...
The Yen has a positive intraday divergence, this means I don't trust the USD/JPY to hold steady on any upside, which wouldn't be surprising as it has been carrying a negative divergence intraday, it's just the $USDX and Yen didn't have any solid confirmation earlier.
And that ES 5 min chart, the prerequisite to any trade, for instance for a short SPY trade the 5 min ES chart must be negative (my own rules), is seeing a wider divergence than this morning.
As to some of the other averages, I'm looking for upside to exit the IWM calls at a gain which they are now at...
However this is a close in view of the IWM intraday, it's not exactly screaming positive here.
IWM 5 min negative like other assets in the same timeframe and the long version (100 period) stochastic I use to define a trend, looks like it's very close to making a decisive slip below the 75/80 level which is where I consider the up trend/bounce to be weakening dangerously.
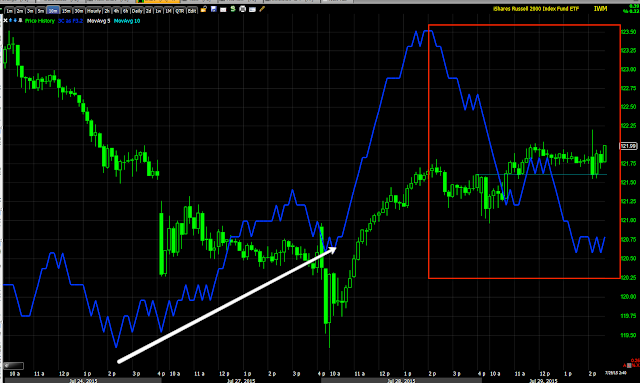
And finally IWM 10 min still in an ugly place as the process of migration of the divergence has reached these longer term charts that were flying positive yesterday.
Again, my plan is to look for the best exit for the IWM calls, then I'll likely look at some assets that I now have good overall charts for a new position like VXX calls as I already put out ad have an open UVXY long trade idea.
Is interest rates about to start going up?
-
Yes, I know - it does not make any sense - FED is about to cut
rates...but....real world interest rates are not always what FED wants it
to be.
6 years ago


No comments:
Post a Comment