Meaning there's still a divergence on a longer timeframe that is essentially the Maginot line for the market. Yesterday morning's early and steep slide was aggressively accumulated as there was plenty of supply (judging by volume), this is more or less what created the second half of the small "W" base the market bounced off and created the "Gas in the Tank" charts.
First the "Gas in the Tank" charts. Until these have serious divergences in them, they still have the power to support this bounce. Most of them formed within about an hour as a lot of shares became available yesterday morning on the initial nasty downside move. While the reverse process is usually just that, these charts "could" turn just as quickly, but we should see pretty solid evidence of that. However, just as we have seen with every bounce since the May head fake failed breakout attempt, any price strength has been sold in to.
DIA's 10 min chart is where it has the most support.
The IWM 10 min chart which made quite a move within a single day for a longer intraday timeframe.
QQQ 15 min which is a solid timeframe that usually can support a swing move, however the base is a bit small for much more than a 2-day move in my opinion.
SPY 15 min which picked up a lot of shares Monday afternoon and Tuesday morning,
Now the intraday charts which are shorter term, they aren't as strong, but they have more detail and tell us what's happening in to the bounce so far. As these divergences become stronger, they move to longer timeframes and when they reach the charts above, all bets are off and I'd want to be well out of IWM calls and ready for the next downside move.
This is the overall IWM 1 min chart before the early run higher from the last post, but the trend is pretty clear.
The IWM 2 min is holding essentially the same trend, but I wanted you to see what happened on the last, early run higher on USD/JPY strength (very light strength)... A negative divergence, again the same trend from all of yesterday, selling in to higher prices.
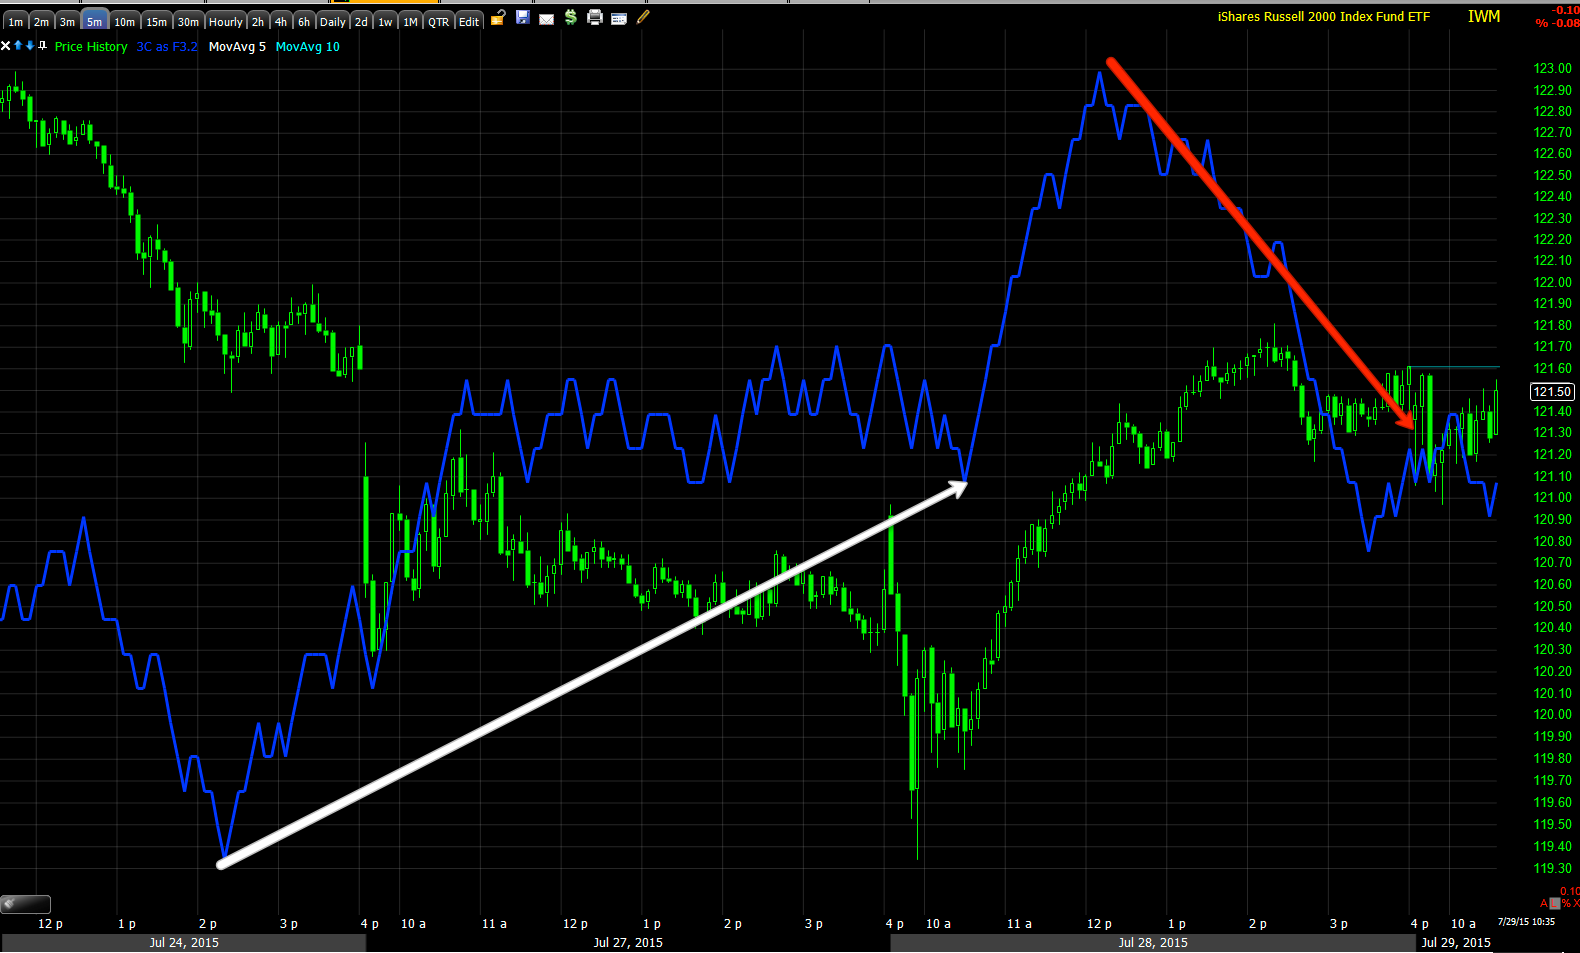
And the IWM 5 min chart with the accumulation of yesterday morning's lows with initial confirmation and selling in to higher prices as the 1 min divergence migrated out to a 5 min chart yesterday.
QQQ 2 min also positive at yesterday morning's lows and also seeing an afternoon negative divergence.
This has migrated to a stronger 3 min chart so the process is there.
The Q's are just starting to move to the 5 min chart now.
The SPY 1 min or SPY in general looks to me to be holding up best, but it is still seeing the same underlying trend.
The SPY 3 min showing accumulation at the "W" base and a negative divergence in to the afternoon yesterday.
It too is seeing a move to the 5 min chart now.
This is probably one of the best examples of "gas in the tank" or the initial accumulation of a fairly large block of shares that's being fed out/sold in smaller chunks in to price strength, also allowing larger sellers to sell at higher prices and short positions to be initiated or added to.
That's about where we are right now.
As you saw last night, Leading Indicators as of yesterday's close were about in line, although not leading positive, they too should see deterioration as an early warning signal.
Also watch for higher prices and weak intraday breadth via the TICK.


No comments:
Post a Comment