The last couple of days Leading Indicators have not been so much useless as they have been in line with the price trend, which is valuable information to know just from a trade management position, for instance, the IWM calls put on Friday and Monday for this bounce may have been managed using some of the information from leading indicators, however the 3C charts and the nature of options , especially those expiring tomorrow, overruled leading indicators as they would have been worth significantly less ( a loss) today vs a small gain yesterday.
I won't be disingenuous though and say that I don't prefer them when they are giving a signal, either way (up or down), that's where they tend to be most useful. As of yesterday they were of very little help at all, today they are starting to move for the first time since the bounce started this week which is a change in character and those lead to changes in trends. I also have a couple of market supporting mechanisms and where they are at.
Here's what we have so far..
The SPX:RUT ratio (
Custom Indicator) is in line intraday with the market which is fine, it makes any divergence between the two later on all the more important.
However our Pro Sentiment indicators have went negative for the first time since the bounce started this week. This is the intraday chart vs the SPX (
green).
This is the same asset vs the SPX covering this week's bounce and as you see, as I was noting earlier in the week, there wasn't much happening there, although the ROC did fall off yesterday which is an early change of character, it's much clearer today.
this isn't necessarily the kind of signal that I get really excited about, but everything has a beginning and it looks like the start of the signal is in.
Our secondary/Confirmation version of Pro Sentiment is showing the same thing intraday vs the SPX and it has been even more in line with the SPX during the ounce this week so it's a notable move.
The same asset on this week's bounce vs the SPX nearly perfectly in line until today.
As for 30 year Yields, I noted yesterday after the F_O_M_C they dumped (green arrow) and closed an hour after. Today as I mentioned earlier they are leading to a newer local low.
This is just a wider view of the same since the last bounce off the SPX-200 day for some perspective.
As for the USD/JPY which has clearly been supporting the market this week, it is stalled, but that's not so much the important thing.
I believe it is stalled for near term market support, call it the gap fills, whatever you like. However to do this, just to jeep the pair in place, look at the pump they needed to effect in the $USDX...
$USDX 1 min intraday, which typically would move down on a dovish F_O_M_C like yesterday, but it seems it is clearly meant to support the market via USD/JPY until whatever needs to be done is done.
I still believe that the initial signals, again they weren't there yesterday, are building and the FX pair that has been leading the market will turn to the downside.
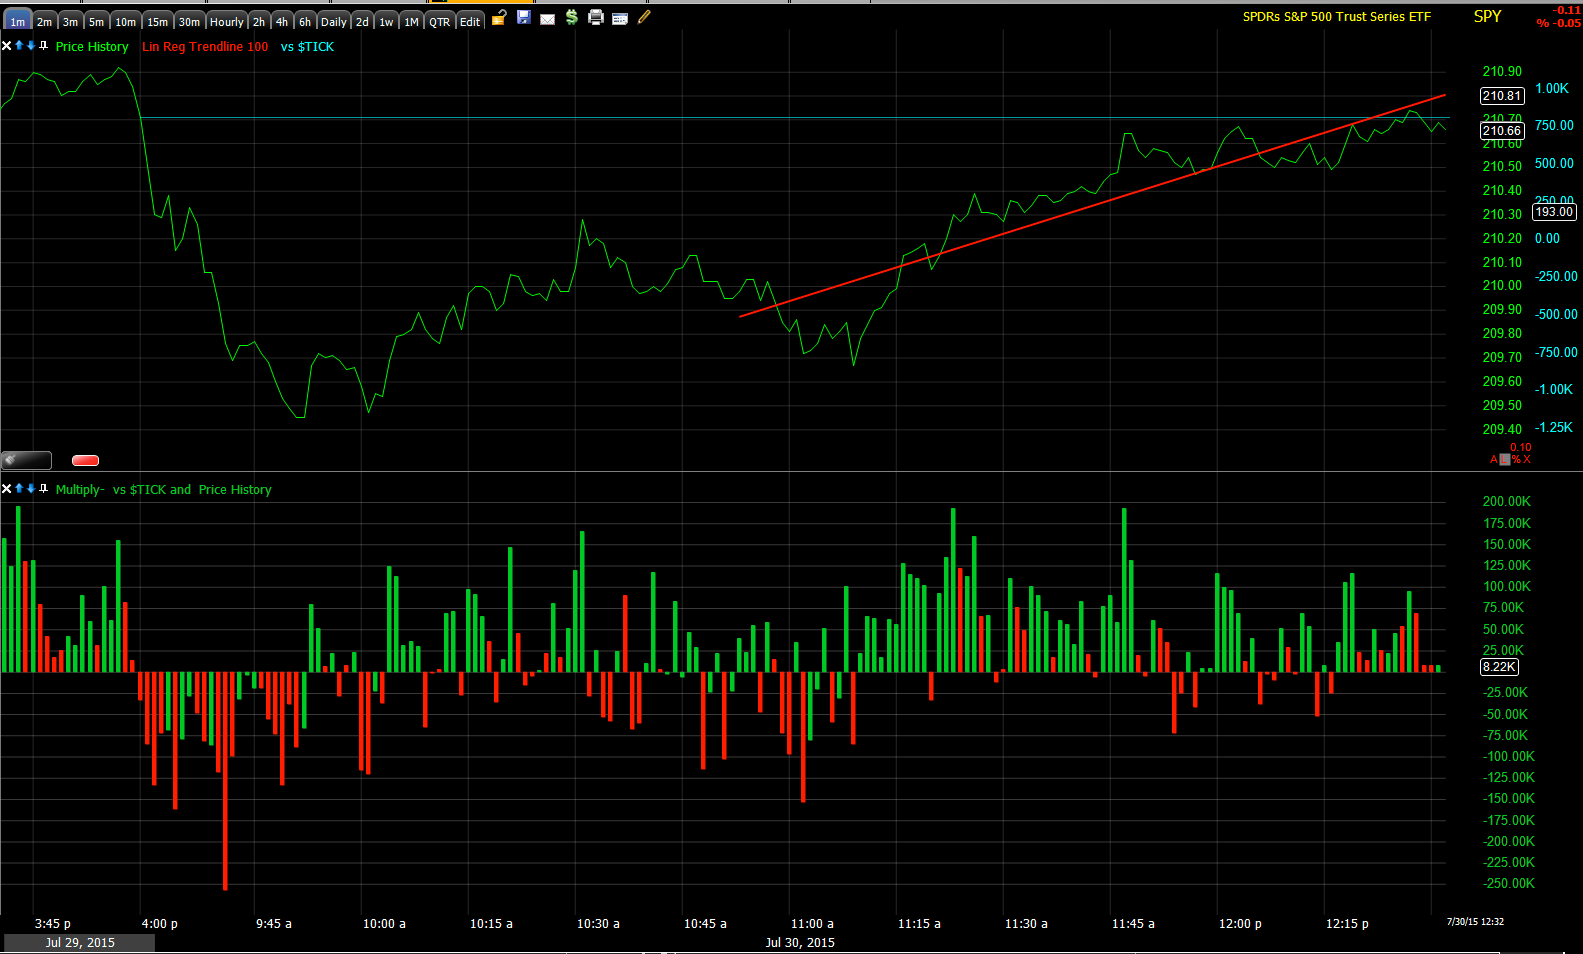
As for intraday NY?SE TICK, it lost that nice clear channel to chop, but has hit some +1000 areas and not much on the downside, but this is a bit deceiving unless it's put in to context.
Our custom TICK cumulative trend which is showing today only and as you can see intraday breadth was poor in the morning, recovered for a gap fill and is now deteriorating again.
I would ask that you recall last night's larger daily breadth charts posted in the Daily Wrap, there's a VERY clear breakdown in equities that the magic of index weighting is pretty good at disguising until suddenly it isn't anymore and that's why I use to use the analogy of the market being like a pier over the ocean that's shiny and beautiful on the board walk, however the pilings that hold it up are rotted just under the water line and no matter how good the ginger bread house looks, at some point those pilings simply break as we are seeing in China despite incredibly amazing attempts to beat back the bearish tone in the market. The Chinese markets no longer resemble anything close to a free/open market.
It's pretty darn hard to essentially tell people if they sell or short sell they can be arbitrarily called malicious sellers and jailed. If that won't fix the problem, you have to wonder what would?
And the chart of NYSE TICK breadth since the bounce this week with a mini-capitulation event at #1 or what I sometimes call a downside flameout and improvement at #2 with a reasonable TICK trend through the bounce, but deterioration at #3 currently.
Given the state of the daily breadth charts that haven't been able to even move up on the last bounce, any breadth deterioration is pretty serious.


No comments:
Post a Comment