Last week we had quite a few days of $USD positive divergences and $JPY (Yen futures) negative divergences which was one of the clues the carry pair would move higher this week and that it would be a support mechanism for the broad market .
You've probably seen the charts comparing USD/JPY to ES/SPX Futures numerous times, but in case you haven't or didn't realize just how much influence the carry pair has...
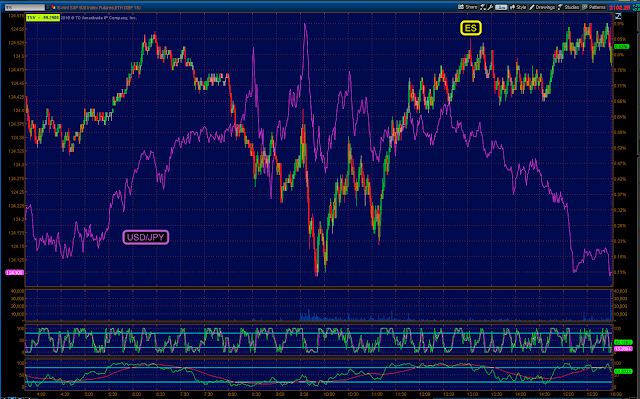
USD/JPY (purple) vs. ES/SPX futures in candlesticks for this week's bounce. Initially the correlation is near a perfect 1.0, but even when the correlation is not perfect, the trend of the USD/JPY is clear and the trend of ES during this week's bounce is clear. The correlation between the two is clear and there are a lot of reasons for that right now beyond the reasons of 2 years ago.
Today at the yellow arrow Index futures/market averages saw early weakness, one of the first things I posted today was that we should at least get a gap fill and one of the factors that went in to that analysis was the USDJPY still strong, still leading ES at the time of this morning's weakness.
However one other thing changed today for the first time since last week's divergences in the individual currencies that make up the carry trade pair (USD and Yen) and gave us a clue of what to expect this week. The change today was for the first time this week (or the first time since last week's $USD / Yen divergences) today we got the first solid divergences in $USD and JPY after not showing anything all week/
$USD went negative and despite running it up higher today just to keep the pair in place as support (not even move the pair higher), eventually the $USD succumbed to the intraday negative divergence and headed lower.
While the $USD alone could be construed in a lot of different ways, especially the day after the F_O_M_C, it was the second divergence in the Yen that was most telling...
An equal and nearly opposite positive divergence in the Yen futures intraday and you can see they too succumbed to the divergence and launched higher in to the close.
This is the EXACT OPPOSITE signal the two were giving late last week which was one of the clues that we'd see a market bounce this week.
Remember the afternoon update showing the USD/JPY in a squeezing volatility price pattern which implied a highly directional move, well you can see the result for the FX carry trade pair this afternoon in to the close.
So one of the mechanisms that has been used to support the market this week and very specifically at today's morning lows as seen above on the first chart at the yellow arrow, has been so far, kicked out from under the market.
A closer look at the initial move...
3 min chart of USD/JPY (purple) vs. ES/SPX futures (candlesticks). While I don't specifically use the USD/JPY as a Leading Indicator because it's only a Leading Indicator right now due to its carry trade status and that's a dynamic that can and will change as it has many times in the past, I can say that if it continues to lead the Index futures lower, it's not going to be good in any way for the broad market.
What I'm most happy about is that the individual currencies, nor the pair showed any divergence unless and until it was time for them to move. In other words, 3C did what it was suppose to do. Now we'll see what the USD/JPY does and how it effects the market.
Is interest rates about to start going up?
-
Yes, I know - it does not make any sense - FED is about to cut
rates...but....real world interest rates are not always what FED wants it
to be.
6 years ago


No comments:
Post a Comment