Tuesday, July 20, 2010

earnings leaks

So far the analysis on BAC, AAPL, JNJ, GS, Especially HOG, BIIB and USO all seem , at least to this point, to be very accurate-HOG was one of the only stocks that I said looked like it would do well with earnings and it's been up this a.m. Over 15%. We did apparently miss on UAUA, but I didn't put as much analysis into that as I should have with DAL's disappointing earnings, it probably colored my perception. On Trade Guild I mentioned the after hours indications are pointing to a gap down, but we see positive divergences and thus far the market has been moving higher from the gap lower. It looks like 3C is picking up on earnings divergences, which confirms what I've been saying all along-the numbers appear to be leaked well in advance of earnings releases. I'll update as the market changes.

A Bounce? More Earnings Inspections With 3C

Take a look at Trade-Guild tonight and earlier today here at Wolf, I put up a note noticing the change in character in the market. It's possible we may have a bit more upside, do not be fearful, as I have said, there are more down days then up typically even a bear market. You want to limit emotional reactions, especially to earnings which are largely price driven by retail-dumb money while smart money is more then happy to sell into their demand. We don't chase every move the market makes-imagine if we had done that last week on the market rally... the result, a serious butt whooping for a lot of longs that react emotionally to information that has already been priced into the market.

It does feel like something may be coming out the news chute here shortly, maybe Fed policy? However, as I pointed out if the Fed was serious about trying to keep this market up, they would have released it when the rally started to falter, which makes me think they don't have much to work with(besides cutting interest rates paid to the banks reserves forcing them to lend or do something with the money other then sit on it) and if they do come out with some policy directive, it may be largely for show as the midterms are upon us and the incumbents are in serious trouble. In any case, the market seems to be bracing for some move up. Until the charts tell us different (and we DID NOT change course in the last couple of weeks when the Dow saw it's biggest 1 week rally in years, because there was nothing objective to change my mind-and good thing we didn't).

Read Trade Guild for more on the market, AAPL and BAC.

Tomorrow we have JNJ which is a biggie, not sure when they report though. Here's the analysis on JNJ (and by the way, I received several emails from people who made some money in the DAL trade short term when it was down over 9% intraday-nice gain for a day).

This is a two day chart of JNJ, look at all kinds of different chart timeframes, you'll be surprised what you can find in other timeframes. I used a 2-day chart here to show more clearly a probable Double Top and a bear flag. In the past, the second top of a double top often fell short of the first one-this is not how the market works anymore. Remember, they know what everyone is looking at and they want to use that against you so it's more common to see that double top (the second one)  give a false signal by "appearing" to be making a new high and continuing the rally. What happens? Longs get excited and then trapped in a bulltrap and their losses feed the downtrend. In Q2/Q3 of 2010 we see a big bear flag, volume is not perfect but we had a few events transpire where it is not correct, that would explain that. The Red arrow shows a false breakout that seems to negate the bear flag, it's short lived and false moves create fast moves in the opposite direction-same theory as the double top-they suck in longs that feed the downtrend with their selling, converting paper losses into real losses.


Here's 3C (Blue) and TeleChart's MoneyStream in red, both red arrows point to negative divergences at the time of the false breakout from the bear flag, now 3C is in a leading divergence. This is a fairly long chart, but it doesn't seem like the kind of action one would expect if the earnings were expected to be really good. On the other hand, lower prices are better for accumulation, the problem is we see no accumulation!
The 15 min chart is the only place I can find accumulation, but this isn't all that strong depite it's appearances, if you trace price, it's strongly confirming with a bias toward accumulation, MS below is showing the complete opposite.


Blue=positive divergence / red= negative divergence-red boxes= big selling and at the right side of the chart we see a negative divergence at a time when the indices are putting in positive divergences. Looking at the whole picture, my guess is that JNJ (despite any initial reactions), will see downside and the bear flag target will be in effect with a first stop around $52

GS will be of major interest reporting at 8 a.m. I have to say, it hard to find a real bad negative divergence, but I also am quite sure that the settlement (which amounted to a slap on the wrist with a wink and a nod) was likely leaked before it was announced, I think we covered this. So a lot of those positive divergences may be left overs from the settlement with the SEC. The only thing I see that is at odds with the market is a 1 min negative divergence on several 3/4C charts. Here's one-

The red boxes show negative 1 min divergences in MoneyStream, TSV and 3C-this is at odds with the markets behavior and GS reports in the a.m. It appears the Specialists are reducing their inventory before the earnings... why? You'd think if GS was going to pop that they'd want to have accumulated supply to sell? right? I don't know, it's a little mystery, but this is what we have to work with, however expect GS to be  fulcrum of the market tomorrow, as in "as GS goes, so goes the market"-at least for tomorrow to some extent. Keep an eye on this one. After all the accumulation before the SEC news, if earnings/guidance disappoint, then there could be a lot of sellers lined up-and institutional sellers at that.

Do HOG owners love their Hogs more then their savings? 
The easy answer to that is probably yes. I didn't do exhaustive analysis on this one, just a quick look as they are reporting Tuesday and it looks like HOG may very well come in with some good news that the market can sink it's teeth into. Like I said, this was a quick look but it appears to be fairly positive. The thing that makes HOG interesting is that its price position is so close to changing the downtrend, it just needs to get above $25.50 and it will have changed at least one trend from down to up, there could be some room for the bulls there. We'll know soon enough.

DAL took it on the chin for a bit today before the market thew it a lifeline, UAUA reports tomorrow, so more of the same? Is the industry just not in good shape? It wouldn't surprise me. UAUA has a strange triangle top, it's (cyclically  speaking) in the right spot for a stage 3 top (distribution) and although DAL had a different top, it too is stage 3, so there may be an opportunity tomorrow for the nimble to catch a quick move down like a few members did with DAL today. Otherwise, it may be a worthwhile trend trade.

A double bottom-3C showing accumulation there and as I have said-accumulation occurs on light volume-this is Stage 1. Stage 2 mark-up is confirmed with 3C and the triangle top shows signs of distribution and a false breakout, most likely in stage 3, next stop=DECLINE

BIIB
Reports in the a.m., this stock is not looking good. My guess would be that it will not do well over the next few days. Although it has had a significant rally in July, it appears at best 3C confirms the trend in in a few instances the daily chart is in a negative divergence. It reports in the am and while the SPY saw price confirmation at the 3 p.m. rally high, BIIB sold off, so there was 3C relative weakness which without doing an hour work up/analysis on the stock, I can only take it to mean that the results will not be well received.

Now for some questions I didn't answer yet....
USO-this chart is in a consolidation, a big one and the most likely resolution is the preceding trend which is down. I only make 3C calls when a divergence jumps off the chart and is extremely obvious. If I have to search for it, I pass it by. USO is one that I would pass by, 3C is not giving any strong signal which could mean it's in some transition, So next I fall back on the price/volume of the chart which I mentioned, right now it's in a downtrend that is consolidating so I'd guess, besides a false breakout, the path of least resistance is down. However that's a 60/40 call and not a high enough ratio that I would put money into the trade. There are thousands of opportunities, the trick is to find the highest probability trades, USO right now is low on that scale. A break above $35.50 or below $33 would change the dynamics and then there may be a worthwhile trade there but right now I'd just put it on a watchlist.  The typical correlation with the $USD is not strong right now, I suppose it's because currencies are in such upheaval and our government is so out of control with spending that every other country is calling for some other currency benchmark.

Bottom line, until something happens, skip it.

Look for updates tomorrow. If we do get the gain in market prices, it's not something I'd be concerned over. The drop on Friday was enough to put the market into an oversold condition in a single day so there's bound to be some correction, It's when sentiment is so bad, we will see the market forget about oversold and just dump. We are getting closer to that as Friday proved.

Last, if you are not getting updates via email and want them, please let me know.

When we get back into a decent trend and less of this seesaw volatility I will post trades again to the spread sheet. Right now though there's a ton of window dressing and volatility due to opposing forces, on one side we have political/ Fed interests (or surface interests from the Fed) and the other, what the market really wants to do, they are fighting day and night and institutions use that volatility to scare people out of positions set false breakouts and make everything worse and more volatile. This is not a good trading environment unless you can sit in front of a screen all day, then there's some money to be made, otherwise, sticking with the prevailing trend is the best option. They say don't fight the Fed, but there's so much more to that story nowadays then ever before, it's just not a hard rule like it used to be; nothing is anymore-just look at the correlation that used to exist with the VIX-it was reliable-now... it's like a kid scribbling on paper. Correlations are quickly disappearing and rules that use to be hard and fast are fading fast. Like I have been saying, this is a new market and it isn't easy but you need to understand how it works and I hope I can help with that as I learn more every day myself.


In any case, if there's one time you don't want to actively trade, it is during earnings. Why? The whole idea of what we do is to put probabilities on our side and then and only then commit. Earnings (unless we figure this out with 3c in a manner in which we have a strong edge) are a wild card that kill probabilities. That doesn't help our cause and it would be irresponsible of me to feed you some trades just to make it look like I'm doing something. That is not a good investment of your membership and I won't do that unless the probabilities are overwhelming. That said, there are a few ideas people made some money on today, just don't swing for the fences , okay?

Monday, July 19, 2010

Feels Like Something's Coming Out

There are several positive divergences on the 1-10 min charts . Nothing goes straight down and we had a bad plunge last week, keep an eye out for news soon. I don't see any threat to the overall bearish trend assumptions, it's just again, getting from A to B and we are on the last leg of that trip.

Sunday, July 18, 2010

If It's Obvious, It's Obviously Wrong

The Vortex of Human Emotion...

What we saw on Friday, was something like we expected. As I have said recently and posted on Trade-Guild.net in “Looking Long”, DO NOT BE CONCERNED WITH DAY TO DAY VOLATILITY, WATCH FOR THE MAJOR TREND UNFOLDING AND POSITION YOURSELF WITH IT. At least that is where I see the highest probability, lowest risk opportunity right now. If you are a day trader then this doesn't help a lot, but there is some use in it. As I have described Wolf on Wall Street, like a Wolf, we are opportunistic. People all too often try to force trades and assume that the market will work with their investment strategy that may have served them well in the past-IN A DIFFERENT KIND OF MARKET! 

WOWS identifies opportunities based on what the market offers. We can chase rodents, rabbits or big game and I am of the opinion that you'd like to make more money, so why chase rodents and rabbits?

Friday was described like this by about the only person I take some heed of, Don Worden,

“The Worden Report (Friday, July 16, 2010)

Urgent Dumping

It probably doesn't surprise you to learn that the Dominant PV Relationship on this day of days was PDVU. More than 2/3rds of the Russell-3000 were down on increasing volume. PDVU sometimes indicates a capitulatory shakeout, formerly usually termed a "selling climax." The market bounces to the upside (often just temporarily). But when this occurs coming off of a minor top (which this has), it indicates urgent dumping.

For the Dow, not only did volume increase, but it was the heaviest day since June 25 (one day before a five-day plunge that took out the June and February lows). Since then the market has been in a Short-Term bounce. Today that Short-Term Bounce rally was resolved negatively, as all four of the Major Averages deteriorated to Short-Term Downtrends in the data table.

Looking at it on a chart of the SP-500, I believe the probability is that this leg down will violate the July low within a few days. Many will look at the upside reversal that occurred as July began as a so-called "support level." I don't look at it that way. The market merely bounced in a logical spot to bounce within a determined down leg. And I personally expect it to cut through that level again like a butcher knife going through soft butter.

Could it bounce from that level again? Well, yes, of course the market can do anything it wants to, and sometimes it can be very surprising. But this configuration looks to me as if the elevator is heading down. If the market doesn't do what you expect it to do, the solution is always the same. Change your mind and get outta there!

Today's trading stats were atrocious. The Ten Important Averages dropped -2.99% on average. That's three percent! Wow!

The Breadth Groupings were like a teeter-tauter with a little dog on one side and a 400-pound gorilla with an elephant on each shoulder on the other side. All 31 Major Industrial Sectors were down. All thirty Dow stocks were down. Needless to say, all 16 Groupings were Super-Decisively Negative. “

I reprint this because if you are a TeleChart subscriber and read Don's nightly report, he is as “down the middle” as you get. This is one of the rare occasions I have seen him inject strong passion and extremely obvious expectations into his nightly report. I was stunned just reading it after having read his reports for nearly a decade and having met him several times.

I will be a little more restrained and go down the line of, “The market's in a horrendous position, but it can do anything it wants”, meaning I'm very confident we will move from “A” where we are, to “B”, somewhere much lower then we are currently, but I will leave some room for market surprises along the way.

What we saw on Friday was not a mesurured reaction to earnings or to Retail Sales, it was emotional. There are two forces that dominate the market and cause it to move, you may say supply and demand, but it is actually Fear and Greed. This is an extremely fearful market which gives institutional money an angle to work, if they themselves have not been badly damaged in this tsunami.

As I mentioned on Thursday and I think Wednessday too, new members should be easing into short positions unless we are breaking serious support levels which was clearly evident by price action alone on Friday, then you want to turn up the volume; so you would have wanted to accellerate your accumulation of bear positions.

Despite the spanking the market took, we are still in decent position to add to shorts and any strength should be used for that purpose. As I have said many times before, there's still a lot of downside and actually we haven't truly even really kicked this bear off. Below $104 (SPY) is where the action will really accelerate.

The first thing to look for Monday and early this week is “Follow Through”-more downside, more volume, more bad breadth. However, remember that there are typically more up days then down days in a Bear market.  I saw this today by creating a quick custom indicator, there are way more days that close below the previous days median volatility or median ATR. I think there's a custom indicator somewhere in that truth-I'll be working on it.

Support levels on the SPY will include: $106.60-we're right there, a stronger level will be found at $105.90-$106.15; this is where you “may” see a short intraday bounce (50/50). There' weak suport at $105.60 and a stronger level at $105. The big test will be around $104.40 with a minor test at $104.70. The major obstacle at this point and the one that will truly RE-ESTABLISH the downtrend will be found, as Don said, at the July low, this level will tell everyone, “The Downtrend is back” and there's no arguing with it. The level is found at $101.13. The probabilities of a bounce at that level from there to $105 are better, maybe 65% chance. However if emotion rules and sentiment stays sour, then I agree with Don, “A Hot Knife through butter”.

Google (GOOG) is in big trouble and will likely lead the market lower. I think the next stop for GOOG will be $400 where it will likely bounce and may put in another leg down. Strangely, GOOG is working on a bullish price pattern called a descending wedge. In a bear market, bullish patterns are more likely to fail, but the bigger they are, the better chance they have and this is big. If it does breakout from this pattern-(let me say the false breakout last week will push this down fast) then it's upside target will be close to $600!!?? We do have to keep in perspective though that GOOG has been in a bear market a lot longer then the market itself so it may make some sense. In any case, there's short side money to be made there for now


AAPL is another horrible looking chart and market leader. This is a clear trianlge top which saw a false breakout-as I keep saying, the market doesn't work like it use to and a lot of suckers got caught in that flap; they'll be quick sellers soon. The volume is astoundingly bad as is this 4C indicator is showing pure exodus out of AAPL. On the downside, we can expect at least a move to $150, maybe even closer to $100!!


Will RIMM fare much better? At first look, this looks to be very lateral, but upon closer inspection and with 3C in yellow, we see a clear top, clear support that was broken and a classic rally to support were it failed and got dumped. The gap down in Rimm back in late June is an excellent example of stops piled up at obvious support and near a whole number ($55)-BIG MISTAKE. There's still a lot of overhead supply to feed the bear here and I see a target of $35. The stop is way to obvious at $55, I'd give it intially a little more room, but I doubt it'll be visiting that area again. This is in excellent position now for a short, just remember a wider stop and take fewer shares initially until we break July's lows.


Mondy, IBM will be a biggie releasing results, however, this is one of those stocks that is difficult to get good 3C signals because of its relative low volatility and the fact it's used as a part of basket trading to equalize ETFs-bigger stocks have this feature of being misleading so if the signal is not jumping off the chart at you, I pass them by. IBM is one I have to pass by. The only thing I see that looks strong is an early morning positive divergence, I'm not sure what time they announce.

HAS is interesting, we have a dichotomy here.


Obviousy on this 10-min chart it apears that there's been accumulation at least by market makers. I wouldn't expect to see this, I'm not comfortable with it, but I report it as I see it and we have a positive divergence on a stock that reports tomorrow a.m. The longer term blue under the chart is clealy negative so maybe we see an intial wave of buying with shorts into that at a later time, maybe a day or two? It's interesting because the accumulation was during the sell-off Friday and they know they report before the market open on Monday-lets keep an eye on this. Short term traders may like to take a crack at this one, but it should be more informative then anything especially as I'm using 3C this earnings season for a different approach.

Here's another oddity, insurance giant Brown and Brown (BRO)-I hated these guys when I was in commercial insurance, insuring the mega-condos on the beach-they had that market locked up so tight you'd have to really get lucky to steal business away from them. In any case, the 1 min 3C shows accumulation? Could tomorrow end up being an upbeat day that puts a temporary emergency brake on the market slide? Should be interesting to say the least, and if you're a day trader, this is another to keep on your radar, long term I'm not a fan of any position here.


DAL-Delta reports Monday at 10 a.m., this is a clear H&S top. At the left in the square, that is good price/volume confirmation-volume up with price and down with price, but when we get into the top formation, it does exactly the opposite, this is why people see a random price pattern and call it a H&S top when it's not-YOU MUST CONFIRM VOLUME AND IT SHOULD BEHAVE AS WE SEE HERE.


 So long term , DAL is a short; when it breaks $11, you want to be pretty close to all in although you could start sliding into the position now.


As for 3C and tomorrow, I don't see much to get ecited over, it looks like it'll go down the drain real soon so that means if it pops, which I doubt, I wouldn't put too much importance on that and probably would short into any strength.


As for the market, there's no doubt that the longer, more substantial timeframes of 3C are all bearish, but there is an strange positive divergence in just about all the averges in several timeframes suggesting that this bear will try to bounce, unless there's something that's not earnings related that we don't know about that is going to hit the wires. Otherwise my guess would be maybe IBM has a decent quarter, but as I said, there's no transparancey there.


So keep Risk management in the forefront of your mind and remember a bounce will get you closer to your intended stop, which gives you less risk and the ability to take on more shares, but we love to phase into positions. The final commitment to a position should always be when it finally does what you are expecting.

So this is a guess only based on what I see, maybe some early strength maybe even a close either up or maybe a small bodied candle, maybe even an inside day. However, it shouldn't take long for this market to fulfill it's destiny. Just remember, if it's obvious, its obviously wrong.

If you need help establishing a portfolio geared for the trend or are stuck in some mucky stocks, or have any other questions, let me know and I'll try to help.

BT46n2@ gmail.com

Have a great week!

Friday, July 16, 2010

This says it all

I hope everyone had a great week, this is just the start of great things to come-as I said, Patience and always-Risk management. We have a huge opportunity that just opened up way bigger then I thought. TODAY was PURE PANIC selling, not the kind you see at capitulation, but the kind you see at the start of a big move down.

Thanks keeping the faith, hanging in there. I'd think most of you (from emails I've received) are well on your way to great profits. Remember, most people got knocked around pretty good reacting to every gyration up and down in the market for significant losses (I've seen those emails from non members too). We've had a strategy and today it really kicked into high gear. Congratulations-Have a great weekend and I'll see you on Sunday.

Oh, don't forget to check Trade guild tonight, specifically look for the link to Cramer's recent foot in the mouth. This is why (he's not dumb) you can't trust what you hear on CNBC for the most part.

Take Care!

Brandt

Good Calls Last night?

I told you we'd look at a company before earnings (last night C) and look at it today.

OK-watch for an intraday bounce here anytime. Maybe a good time to add if you want or need to.

Thursday, July 15, 2010

TONIGHT YOU ARE SEEING THE SAME THING AS WOW SUBSCRIBERS FOR THE MOST PART.


Last night I mentioned a few key words, “Patience” and “confirmation”, this is why we don't need to be active in the market everyday. If you are a professional poker player, do you raise every hand? No, you wait until the probabilities are highly in your favor before you push. While we do have a negative bias to the market and it could have very well continued down today to make an extremely bearish close, we can't know that until it happens. Just like you can't decide to bet until you see your cards. This is also why we phase into positions. You could have taken a partial short position on the afternoon strength today, but you shouldn't go swinging for the fences on a day like today, not until we get confirmation.

While the market is decideldy bearish, it runs on its own schedule; there are thousands of reasons a market can do something other then what you thought it would do, and you can still be correct with regard to the final verdict, but the market will get there in its time, not yours.

A bunch of news was out today, from BP to Goldman Sachs and the market didn't take a strong stand one way or the other. Sure, you can see some intraday bullish activity, but this could be institutions setting shorts, so that bullish activity that you see, could actually be bearish activity. Things are never as they appear in the market.  Or it could be the market simply doesn't know how to digest the news. I believe it's bigger then news (unless the news is totally unpredictable, meaning an event that no one saw coming). I believe what we are seeing probably has some reason behind it. The price/volume relationship today showed a market that reflected the price moves which were in effect nothing. The P/V relationships had a slight bearish bias but were largely spread out evenly, very apprpriate for the price action today.

If we look at today's candle what we see is reminicient of a hanging man, which is a negative, reversal candle as the name suggests-the opposite of a hammer. Taken with yesterdays Harami pattern, it wasn't bullish at all. The recent candles actually look a lot like the SPY's top we saw in June; the volume is roughly the same, even the price level is similar.

(*Note that the Harami is much more apparent yesterday in the S&P-00 index then it is in the SPY shown here). Both had Harami reversals, both were followed by an approximation of a Hanging Man candle, the volume was the same in both and price levels were similar. (Harami in the red box, hanging man marked by the red arrow).

Here's some more in depth review of the intraday charts,

Here's the Bear Flag I mentioned in the intraday update-this flag failed as we saw a breakout of the pattern, however, as usual, we have to be on guard for the false breakouts that accompany so many of these obvious patterns. As you can see, the last candle was pretty bearish as was the volume.

15 min 3C SPY chart-Note 3 negative divergences, all led to downside reversals of some degree (in red), then we saw price confirmation of the trend (white) and confirmation of the move up-there was no positive divergence preceding the move up. While the close can not yet be considered a negative divergence, it did not confirm strongly either and as we saw the last candle of the previous chart, here we see a bearish Shooting Star at the close right around resistance where we saw the earlier negative divergences and reversals.

3C v.3 5 minute QQQQ. This is not bullish action. Note the price levels and the dip in 3C correspondingly. 

SPY 5 min 4C chart. Again, we see the same type of negative action as in the Q's with 4c.

DIA 5 min 3C v.2. And to round it out-the same in the DIA.

Here's some good news, AMPL made a nice gain for our members, but as I mentioned last night, a pullback is coming and here it is. I think it's probably a buy around the 10-day moving average in yellow.

We've been talking a lot about how Wall Street operates and the amount of leaks. I have to wonder if the SEC's action taken-which amounts to a dog and pony show-was well known in advance as we see a very positive divergence in GS on this very influential 1 hour 3C chart? I wouldn't be surprised one bit.

Speaking of Gold..
GLD, purely from a price action/volume point of view is not looking too good. We have a break of the uptrend and now a bear flag present. The 3C charts suggest there's still upside room left. I would not be surprised to see this very obvious pattern shaken out so I have an initial upside target where the blue box is, which corresponds to the "Kiss Goodbye" of resistance, but even that is obvious so the target could be a bit higher. If you want to take action on a short play of GLD, wait until it breaks below the flag. It is okay to phase into the position at higher levels, but not more then 50% until we see that break below the flag. Note the volume, it must diminish like it is doing now to confirm a flag.

We have several financial institutions reporting tomorrow wich should be interesting.BAC earnings are reported tomorrow, I'm not sure when though.

BAC will be interesting because it formed a weak Harami reversal yesterday as did the market, however today it put in a bearish engulfing candle that I would normally take as confirmation, but with earnings tomorrow, I'd wait on this one. However, remember it's not the news, but the way the market reacts to the news so earnings may blow away consensus, the stock could still sell-off. Keep an eye on this one as an opportunity is at hand if all goes well. The red trendline, if broken, would represent the area where you'd want to be "all in" the position, however you can and should phase into the short above support if the reaction is bearish.

Charles Swab will report as well as Citi below,
Here's Citi's daily chart with 3C in the top window and MoneyStream in the middle window. Both indicators refuse to confirm the price breakout-not bullish.

Here's C's 4C 60 min chart, again we see a failure to confirm the breakout-negative divergence.

C's 4C 30 min chart, shows the same failure.

The 15 min chart did not confirm the breakout, but there is some confirmation in this afternoon's move. If the market did not react this way, I'd think maybe C will come out with something it could rally off of, but since this is what we saw in the market, it's difficult to say.

Here's C'c 5 min 4C chart, again we see the same confirmation, even a positive divergence like the market put in, so I'm leaning toward the idea it's just following the market. The 1 min chart shows the same thing. My guess would be, whatever C's earnings are-good or bad (remember it's not the news, but the reaction), it won't respond well over the next week, although it may in the short term.

Finally, the $USD

I warned about the reversal of the dollar to the upside in October last year, I even gave a target of $88, it hit that. I'm using UUP as a proxy, but it looks really bad on this daily chart. Not to say we won't see some rallies because that is evident in some intraday 3C charts, but I think the move is officially over marked by this ugly leading negative divergence in 3c.

For tomorrow, it's "second verse, same as the first". Patience-Confirmation. We'll be there soon enough, there's no need to take risks right now when we don't have the probabilities HIGHLY in our favor yet. As a rule, when I traded full time for a living, I always tried to stay away from trading during earnings, there's too much Tom Foolery going on.

Enjoy your weekend.


JPM

As I mentioned, JPM looks bad all thins considered, but we may have a chance to grab some short shares as it looks like a little intraday bounce is coming as it rides the wave of the market

So Far , So Good

Look at JPM's earnings and look at JPM's price action today, sentiment seems to have shifted as 3C was forecasting.

When we drop below the SPY gap at $108.03, the chances of the reversal being in are much higher. I think you can, if you need to start your short position, use any strength today to do that in small amounts until we cross below the gap. If I had no position at all, I may add 20% today, up to 40-50% below the gap and then keep phasing in, at $104.20 I'd want to be loaded-for me that's 75% of portfolio short with 25% in cash.

Perhaps today's Fed minutes added fuel to the fire.

Sometimes It Doesn't Smell Right

That was last night, it didn't smell right. I was on the verge of calling for a trade in a carefully put together portfolio that would have sacked 30% of the positions I carefully selected through the last several months and I knew it was wrong, it felt wrong because I was considering this purely because that was the direction the sheep were headed, I would have flocked with them and I WOULD HAVE BEEN WRONG, at least up until this point.

So I'm very happy with last night's analysis. The indicators worked, I just needed to listen and unfortunately I needed to find the reason rather then trust objective data, but it all worked out, the huge after hours gap was destroyed by the time we got the Retail Sales numbers, which were bad, but as usual, the media finds the silver lining in "ex-autos", but our economy doesn't run on "ex-autos". The consensus was 2, it came in worse then consensus at 5, a lot worse.

This leads us to something else I've been talking about a lot lately, LEAKS! They are everywhere. Last night's analysis and the gamble that there would be no gap up in the face of a huge after hours indication of a gap, was based on the charts showing selling into what would otherwise seem (on the surface) to be a very bullish environment. Why were they selling into this "Fantastic economy, judging by earnings that are out this far?" Because they knew something the rest of the sheep who were bidding up the market didn't and that thing they knew was, that Retail Sales would fall short. Lucky guess on my part? 10% maybe yes, 90%, I don't think so. I have seen this for years, time and time again, whether it's Fed policy directives or Fed surprise announcements, government oil inventories, government policy, monetary policy (anyone recall my long call on the dollar way back in October 2009 about a month before it kicked off a 20% rally and before the administration said they'd support a strong dollar policy?) Or how about the call 1 week before oil's 5 1/2 year uptrend broke, the same week Cramer was telling everyone to buy oil!

PLEASE, DO NOT MISUNDERSTAND, I'm not trying to pat myself on the back and I'm in no way claiming GURU status. I'm a student and I'm simply following the charts and my indicators; writing those indicators is the only thing I deserve any credit for-everything else is just reading them. And in reading them for 4 or 5 years, I've seen time and time again these leaks, these moves that came out of nowhere only to be followed up by a surprise Fed policy announcement. It's simply the experience of understanding, or starting to really understand how the market really works and it would and will turn most of your stomachs. The amount of corruption in the market is astounding and the parties that are complicit in the corruption are very surprising and quite disappointing. Since I've been onto this, I've received emails from floor and former floor traders that have enlightened me as to how things go down on the floor. In one word, it can be summed up as  "Betrayal". These guys are out there betraying their own customers for their own economic gain and not the gain they deserve for a job well done.

I really liked the idea of straying from the herd, getting out of the mainstream retail thought patterns and creating Wolf on Wall Street, but I never imagined how appropriate the name would become.

Anyway, enough of the rant. Stick around long enough and you'll see it all for yourself.

Besides mastering risk management, I really want you guys to focus on the charts I'm putting up, especially the divergences in charts like 3C. Those charts alone will show you how things really happen. People and I, even think and thought that institutional money helped propel bull market's higher with buying, 3C will show you they bought long before and they are selling into strength. One day soon I'll post the 3C and other charts on homebuilder stocks back in 2000-they were under serious accumulation, but very quiet as everyone focussed on the tech melt down. These guys put together huge positions in the home builders several years before they REALLY took off and guess what they did during the entire bubble that was being created? They sold the entire time-for years-in some cases that is how long it takes to distribute a large position.

Now for tomorrow, the idea and keyword is still "patience." Yes, we can jump the gun and maybe make a few extra percentage points, or we can do the responsible thing, we can practice one aspect of risk management and wait for a confirmed reversal before we start taking significant action.

Here are the charts....

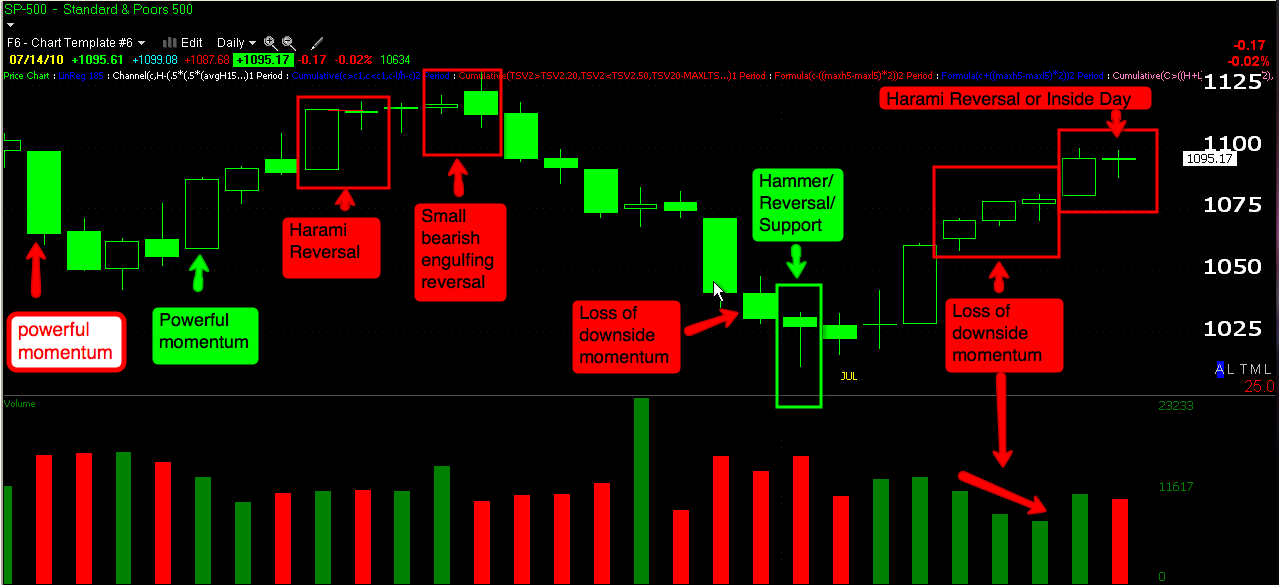
As you may have noticed, I use candlesticks because they do what every good technical indicator should do, they show you human emotions and they have worked for hundreds of years because of one fact-human emotions never change; even the algo programs are written by humans. So take a look at some patterns and candles and look at today's S&P close. Today the SPY formed an inside day, but the S&P formed a Harami Reversal, it should look familiar if you read the chart from left to right. Note how volume interacts with these candles as well.****CORRECTION-the red box with 3 candles on the right should read "loss of upside momentum"******


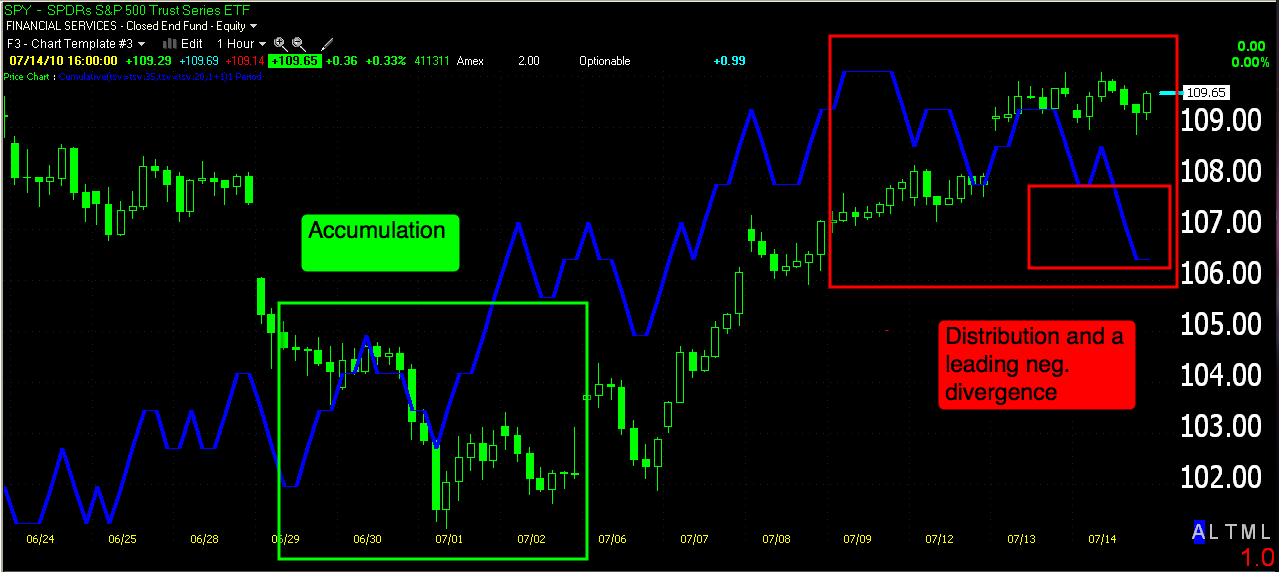
Here's the SPY 1 hour which is the most influential intraday chart showing trends that last weeks or more. This blue indicator is 3C version 3 and in the green box we see accumulation (price makes lower lows while 3C makes higher lows=positive divergence/accumulation, eventual reversal). In red we have the opposite, a negative divergence. Note how price can not escape the gravitational pull of a leading downside negative divergence.

Although this chart is a bit longer in the zoom factor, it looks just like the chart above, but it's the DIA, not the SPY-remember that markets usually flock together.


And this one? The QQQQ. Looks similar right? So this is telling us that there's distribution which leads to a reversal. We can still have a bumpy ride, but the big picture here is saying that this rally isn't so strong, in fact it's most likely a typical Wall Street shakeout.

Here we see a detailed 5 min 3C version 2 chart of the Diamonds (DIA). Note the negative divergences in red and positive in green, that is what is so powerful about this indicator, it isn't lagging as most are, but a forecasting tool. In white we have confirmation meaning no divergence and 3C confirms the current price trend which appears to show the possibility of some early strength on a short intraday basis, a matter of hours most likely if it keeps up.

The Q's show the same confirmation all the way to the right. Be sure to click on the charts and read the annotations. Remember, these are two different ETFs for 2 different averages using 2 differently written codes for 3C showing the same thing.

Read the posts here and at Trade-Guild about BAC and what happened this past weekend and you'll understand why it's in such bad shape on this 4C daily chart. This is actually a negative leading divergence.


We know that there's distribution on the daily chart, so we turn to the intraday charts to try to pinpoint the exact point of reversal. Right now this 3C version 3 is showing a leading negative divergence, suggesting the bounce in BAC (largely moving with the market "A rising tide lifts all boats") is just about done. Look at the last negative divergence on the left and how it led to a reversal (red arrow) and the positive divergences that led to the bounce (green arrows-cause and effect are very easy to see). The difference now is that the daily chart is in much worse shape. I have a feeling this is the last time BAC will be above that support level that has been in place for 11 months and that makes this a stock worth considering as a key short, but WAIT for confirmation or ease into it for risk management's sake!

And AMPL! It's been a rough ride with the volatility in this low priced stock, but I've maintained my bullish view on the stock for one reason only, here it is....


This daily 3C v.3 chart is in a monster leading, positive divergence. This stock has been under accumulation for awhile and on a day that the market was lackluster, it gained 7+%-I said I liked it as recently as last night and has been featured here for several weeks. This is a great pattern and it may pullback, but I think it has several months of rally in it judging by the amount of accumulation-and this in a poor market overall!

So the plan is the same, be patient-if you are new, take a look at some of the shorts we are using on the June list including June 2 or 3rd (I think 3rd)-it has ETF's that cover all the major disaster groups, but mix in some straight up shorts as well. Past articles will explain why.

Be patient, wait for confirmation before swinging for the fences. Many of you who have been here for awhile already have your position in place, it's just a matter of managing the trade at this point. For the new members, when the SPY is back below $104.40, we expect to see a viscous drop and I personally want to be 75% short at that point (and already am), then save at least 25% in cash for opportunities and possible hedging.

I'll update in the a.m. If you do not receive the email updates, please email with the address you want them sent to. Have a great rest of the week.