Wednesday, July 21, 2010

An earnings play

The symbol is SBIB the trade is long. this is very speculative, they report in the a.m.

Another Update


Above the 15 min is in a leading downside divergence and below the 1 min is suggesting an intraday correction with a positive divergence, overall-the market is looking bad

Afternoon Update

Last update we saw the fast 3C on the 1 and 5 minute charts in a negative divergence.
Here is the long term 3C on a 10-minute chart in a leading negative divergence-this is very powerful.

Morning Update


Above are two negative divergences on the fast version of 3C, this where divergences on short timeframes show up first.

There were some good earnings out and some bad today. The news says traders are mulling over the batch of reports, this looks more like a holding pattern waiting on Ben Bernanke's Congressional testimony today this afternoon. We already know that he's going to say that the Fed stands ready to keep the market momentum (or perceived momentum that was thought to exists) alive.

Why is the market not shooting ahead right now? Because they want to hear the tone of his voice, they want to listen for any nuance, subtle contradiction, they want to figure out of the Fed is able to anything. Interest rates are about as low as they can go, the only seeming tool the Fed has to really twist the banks' collective arms is to stop paying interest on reserves and force them to do something with the capital they are sitting on.

As I write this, the divergence has deepened. I will continue to watch for any signs, but it seems as if there's not going to be much known until he speaks.

Correction or?

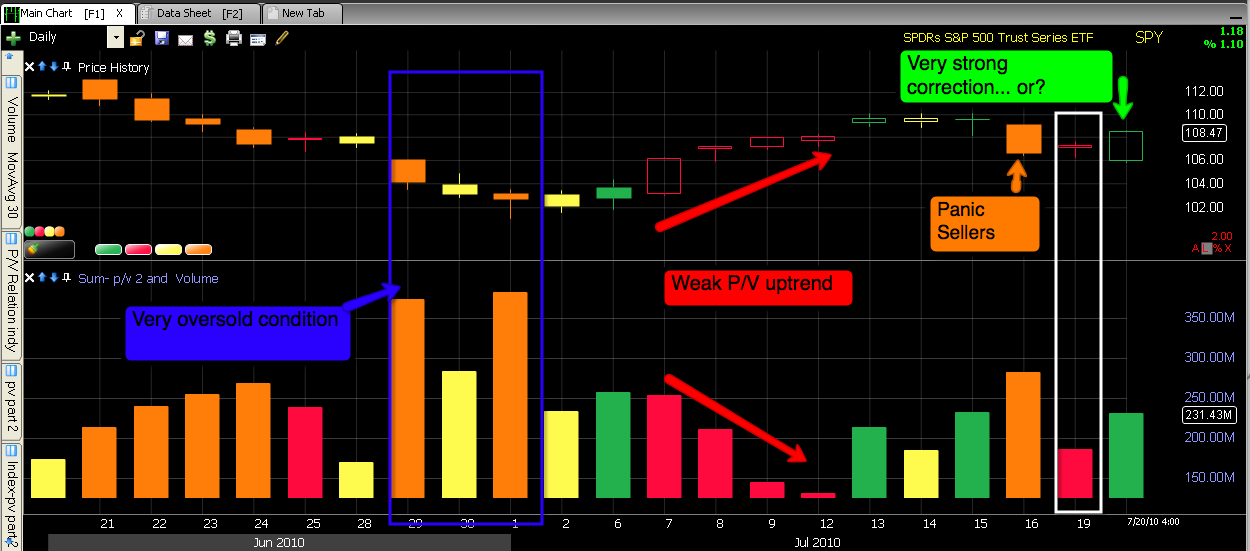
WOW! Last night I warned about strength today, even in the face of a gap down-that's a hard call to make, seeing a gap down like that and saying, "but we'll see market strength". The only way to have confidence in these calls (How about HOG today? Several members eamiled me today that made money in HOG and a few other trades based on the market call) is to trust your indicators, I trust mine. However, accumulation is one thing, but the strength of today's move can not be overlooked. In Western terms, this is what is known as a "Key One Day Reversal", in Eastern, candlestick charting terms it's known as a Harami reversal (day 3 and 2) and today (day 1) is a "Bullish Engulfing" candle. The volume was up, not on par with the massacre on Friday, but up substantially from yesterday. The price/volume relationship as you can see from the chart below, was Price Up/Volume Up, the most bullish of 4 configurations.

The only thing not annotated is yesterday in the white box, this is the Harami Pattern. Today we got Price Up/ Volume Up, and a strong candle on volume. This is surprising to see as a correction, the configuration usually leads to a more substantial move. Friday did create a one day oversold configuration which is rare, now we are seeing almost equally volatile price action today. This is why earnings and tops are so difficult to trade.

Good thing to remember, the close of the previous day is typically the first zone of resistance/support. Note volume picking up as it crossed through resistance. A couple of things happened, longs jumped into the trade there and shorts covered there. This is exactly why I say to keep your stops in your head, putting in a stop with your broker is showing the market your hand. Typically at 3:30 on toward the last 10 minuted of the day, we'd expect to see day traders closing out positions and a little but of a loss of momentum. With all the new developments including algo trading and prop firms being shut down, day traders don't have the same influence on late day trading. So we saw a very strong close, we also saw a very bullish price volume dominance of Price Up/ Volume Up which is the most bullish. Taken with the successful Harami reversal and the engulfing candle/ Key one day reversal, this was a strong day. I expected strength today, I really had no way to say it would be this strong.

This 5 min 3C ver. 3 was the most accurate in calling today's move. You can see a strong positive divergence toward Monday's close. I find it strange with all of the other apprent strength today that this 3C chart was not able to make a new high with price. This is, of sorts a somewhat weak relative /negative divergence, but it suggests to me that there's some fading momentum, not downright distribution. This leaves the gate open for more upside in my opinion. However, as I mentioned before this move up got started, I anticipated a couple of days of upside.

This 3c ver.1 5 min chart of the SPY shows a positive divergence at this morning's lows and the rest of the day it confirms the price trend. It is rare to see a positive divergence in an uptrend, although they do occur, so this is actually a fairly strong chart.

This same 3C chart, except 10 min has been pretty reliable in the past. This is the first timeframe in which we see a negative divergence, which I would interpret as the start of selling into strength, but not an imminient reversal. Of course smart money's not always smart-Lehman Brothers comes to mind, however, I find it hard to argue with the evidence. It seems to me that we are in for at least two more days of upside, unless we see a lot of selling in the 1-5 min charts tomorrow, it wasn't really there today.

Here's something interesting, the SPY 5 min 4C chart, which provided a leading positive divergence Monday, a very pronounced one. In looking at this chart yesterday, there was very little chance of not seeing upside today. It has formed a mild relative negative divergence between yesterday's close and today's close. This is really the strongest case I have toward distribution and it's fairly mild.

Now that I've posted so many charts that seem to not give us much perspective on the market, I will explain why.... The name "3C" stands for "Compare, Compare, Compare"-it's a reminder of what good analysis is all about, comparing, putting together as many pieces of the puzzle as possible. The point I'm trying to make other than, brace for more probable upside , is that we do not see consistency between the indicators like we did yesterday. I call this the fog or the Bermuda triangle, this is a situation where any call is not backed up by high statistical, objective probabilities. IT makes me nervous to say anything regarding market direction as there are a few different doors open and it's most likely because all versions of 3C/4C are written differently precisely so I do not get the same signal unless it is very strong, then they align like yesterday or today's move in HOG which could be seen with quick view.

So lets look at what this could mean
Although the market is good at manipulating price patterns, the bigger patterns such as this Head and Shoulders are very dificult to manipulate. This is a consensus of human emotion. It's a stage 3 top of proportionate size found where it should be expected with 3C daily charts confirming it. People talk about the failure of the Head and Shoulders May-July last year, but they didn't take the time to validate the pattern. It has been said that one of the main attractions to technical analysis is laziness and that is what happened back in 2009 with the H&S, YOU MUST CONFIRM THE PATTERN WITH VOLUME and in this case, we have confirmation. The greeen arrows are pointing down, this is volume n the rallies, the red arrows pointing up is volume in the sell-offs, this is what confirms a Head and Shoulders top. It's difficult for me to believe that this top will be voided. So if the market rallies the next few days, you know what to look for-VOLUME! If it dries up like we have seen in every other rally during the top, then this is not a serious threat to the top and the short position is justified. If it does increase in volume, if it surpasses the blue arrow and most importantly the red arrow above price, then we have a problem with this top.

Many have talked about the "Summer Rally", even people I respect. It's almost a Wall Street cliche now it's so embedded into our technical brain. There have been years, even in Bull markets like 2004 where we didn't see a summer rally. In 2008, at the right edge of a Head and Shoulders the summer rally that started late July was worth about 3.5%-not a very big deal especially considering the fact that Friday we saw a one day move that was nearly equal to the 2008 summer rally. The point is, your analysis sholdn't be based on superstition, but objective data.

Bottom line, we watch carefully tomorrow for any indication of a halt to higher highs, higher lows. We watch for volume, does it increase or decrease? Of course I'll be watching developments in 3C, but to remind you of the most powerful and telling of all the charts,
This is the grand daddy. In the green box, TSV largely confirms the trend, except the orange box within it, we see the distribution start in October-same as the blue arrow on the 3C chart. The red boxes both show extreme leading negative divergences, these would be exceptionally difficult to turn at this point, something amazing would have to happen in the economy. So keep in mind the long sighted view as well.

As fr the next few days, continue to honor your stops, no cheating and moving them up unless you have an exceptionally good reason-you can always short at higher levels and recoup any losses taken by stopping out. Take a small loss and you won't be faced with taking a large loss. Learn to love taking small losses, that's your survival mechanism in the market.

If you have the time and are nimble, you can certainly play some longs. Several members emailed me with long plays they made money on today including HOG as I warned last night we'd see upside. One of my favorites for a quick bounce is UPRO, it;s 3X leveraged, you don't have to worry about earnings or news really and it'll generate a nice little return in an quick pop up.

Now, looking forward to tomorrow's earnings as people have been making money on this new twist I've thrown into the mix.

JNJ did what was predicted in last night's call-it was down on a nice gap and there was downside off the opening, not that it's a high beta stock, but 3C was right on. And b the way, it broke the flag, so watch for the target to be met. GS wasn't much of a call, the biggest thing there was, "as GS goes, so does the market" and that's what we saw in price configurations today. HOG was a huge success, like DAL the day before.

As a quick possible trade of a day or so, because after that it's murky, USO appears that it will see some downside tomorrow-watch for a possible gap up that falls back into the triangle. If that situation unfolds, this may be worth more then a day or two, a false breakout in USO right now will most probably create a downside sell-off that would be worthwhile.

Now please keep in mind what we are doing here with these earnings calls (I NEVER used to trade or recommend trading earnings), we are trying to find possible leaks that the market is acting on before the earnings come out, this is the first time I've used 3C for this and quite honestly it's pretty tricky, so don't go betting the farm. First up in Altria (MO), which I'm ashamed to say that I have contributed to their sales this year, I may have even made their quarter :( Please no emails, I know, I know-but all traders smoke, right?

This 4C 5-min chart has been accurate and honestly I like the stocks that are reporting early because you'd expect to see the final exodus the day before in the afternoon. I think they come out at 9 a.m. Notice the sell-offs around the $21.45 level. There's been about 7 day of resistance there and it seems to be coming from the late April, very early May top that formed right before the sell-off. then we saw a move above in mid-May, it didn't hold and was an obvious false breakout. Why obvious? Look at what happened next, it took a 10% nose dive-false breakouts reverse quickly and violently and in this case, on big volume. Today MO broke out, any other day and I might feel differently about it, but it appears that they used the market strength to perhaps create one more false breakout, one more opportunity to sell at higher prices and set shorts. 4C could not confirm the afternoon close higher. My opinion is that this will not do well whatever the earnings are, the only wild card is the "rising tide lifts all boats" meaning general market strength, still, I feel this is probably a bull trap today. Otherwise it seems to be a decent short on a longer daily basis.

BIDU has negative divergences on 3 different time frames, even MoneyStream in red is divergent. I'm expecting weakness here. Even today as it moved up with the market, it could not muster any volume. It's also in a daily triangle-looking top.

FCX 1 min 4C chart. All 3 3C charts are negative on the 1-5 min as is the 4C chart you see here, price rose with the market, but it seems apparent that there was selling into that gain while the rest of the market at least confirmed. FCX should report pre-market. If you get a chance, look at the last 30 minutes where it actually starts making lower high/lower lows=downtrend on high volume. I think this is a pretty good candidate for a short-sell trade.

Good News?
This is a 10 min 3C chart of GSK, 10 min is pretty substantial and you can clearly see the positive divergence yesterday and today we have a leading positive divergence, the most powerful and on a 10 min chart. I feel that this one is going to respond well to earnings.

Finally, for tonight-this is the one I'd rather skip, but this is one stock that will be or has the ability to be the fulcrum of the market-UTX
On a daily chart, UTX looks remarkably like the S&P-500. There's one difference-this 4C chart does not look like the SPY. We have the positive divergence yesterday, but today toward the close, actually earlier then that, we see distribution. There's also some bigger negative volume and this is what has me a little hesitant. Although the assumption I'm making by putting this chart in this section is that earnings leaked, the volume at the end of the day could have influenced 4C. 4C is meant to pick up on quiet accumulation/distribution, but the anomaly in volume could effect it. The reason I went ahead any way is all the 3C 1-5 min charts are negative and the divergence started before the volume really got heavier at the EOD. So the assumption here is we have a possible leak in UTX regarding earnings and it won't respond well. If that is the case, this one could very well influence the market. UTX reports pre market.

Happy Hunting

Tuesday, July 20, 2010

Update

Ok, this is the strength I was seeing last night, the 1 min 3C is inline , confirming the price trend, but on the 5 min we are starting to see more distribution.

WFC which reports tomorrow is seeing  short term 1 min negative divergence, but in the other timeframes it appears to be pretty positive. My guess "GUESS!" would be that they have good reaction to earnings Wednesday-keep an eye on that one it, may be worth a shot with a tight stop.

I'd think the market will pullback around 3-3:30 and then finish strong.

Update

The higher prices I expected to see in the market were based on a 5 min positive divergence, both 1 and 5 min positive divergences are loosing momentum, it could be a temporary consolidation, but I wanted to let you know. HOG is also loosing upside momentum for anyone trading that one.

earnings leaks

So far the analysis on BAC, AAPL, JNJ, GS, Especially HOG, BIIB and USO all seem , at least to this point, to be very accurate-HOG was one of the only stocks that I said looked like it would do well with earnings and it's been up this a.m. Over 15%. We did apparently miss on UAUA, but I didn't put as much analysis into that as I should have with DAL's disappointing earnings, it probably colored my perception. On Trade Guild I mentioned the after hours indications are pointing to a gap down, but we see positive divergences and thus far the market has been moving higher from the gap lower. It looks like 3C is picking up on earnings divergences, which confirms what I've been saying all along-the numbers appear to be leaked well in advance of earnings releases. I'll update as the market changes.

A Bounce? More Earnings Inspections With 3C

Take a look at Trade-Guild tonight and earlier today here at Wolf, I put up a note noticing the change in character in the market. It's possible we may have a bit more upside, do not be fearful, as I have said, there are more down days then up typically even a bear market. You want to limit emotional reactions, especially to earnings which are largely price driven by retail-dumb money while smart money is more then happy to sell into their demand. We don't chase every move the market makes-imagine if we had done that last week on the market rally... the result, a serious butt whooping for a lot of longs that react emotionally to information that has already been priced into the market.

It does feel like something may be coming out the news chute here shortly, maybe Fed policy? However, as I pointed out if the Fed was serious about trying to keep this market up, they would have released it when the rally started to falter, which makes me think they don't have much to work with(besides cutting interest rates paid to the banks reserves forcing them to lend or do something with the money other then sit on it) and if they do come out with some policy directive, it may be largely for show as the midterms are upon us and the incumbents are in serious trouble. In any case, the market seems to be bracing for some move up. Until the charts tell us different (and we DID NOT change course in the last couple of weeks when the Dow saw it's biggest 1 week rally in years, because there was nothing objective to change my mind-and good thing we didn't).

Read Trade Guild for more on the market, AAPL and BAC.

Tomorrow we have JNJ which is a biggie, not sure when they report though. Here's the analysis on JNJ (and by the way, I received several emails from people who made some money in the DAL trade short term when it was down over 9% intraday-nice gain for a day).

This is a two day chart of JNJ, look at all kinds of different chart timeframes, you'll be surprised what you can find in other timeframes. I used a 2-day chart here to show more clearly a probable Double Top and a bear flag. In the past, the second top of a double top often fell short of the first one-this is not how the market works anymore. Remember, they know what everyone is looking at and they want to use that against you so it's more common to see that double top (the second one)  give a false signal by "appearing" to be making a new high and continuing the rally. What happens? Longs get excited and then trapped in a bulltrap and their losses feed the downtrend. In Q2/Q3 of 2010 we see a big bear flag, volume is not perfect but we had a few events transpire where it is not correct, that would explain that. The Red arrow shows a false breakout that seems to negate the bear flag, it's short lived and false moves create fast moves in the opposite direction-same theory as the double top-they suck in longs that feed the downtrend with their selling, converting paper losses into real losses.


Here's 3C (Blue) and TeleChart's MoneyStream in red, both red arrows point to negative divergences at the time of the false breakout from the bear flag, now 3C is in a leading divergence. This is a fairly long chart, but it doesn't seem like the kind of action one would expect if the earnings were expected to be really good. On the other hand, lower prices are better for accumulation, the problem is we see no accumulation!
The 15 min chart is the only place I can find accumulation, but this isn't all that strong depite it's appearances, if you trace price, it's strongly confirming with a bias toward accumulation, MS below is showing the complete opposite.


Blue=positive divergence / red= negative divergence-red boxes= big selling and at the right side of the chart we see a negative divergence at a time when the indices are putting in positive divergences. Looking at the whole picture, my guess is that JNJ (despite any initial reactions), will see downside and the bear flag target will be in effect with a first stop around $52

GS will be of major interest reporting at 8 a.m. I have to say, it hard to find a real bad negative divergence, but I also am quite sure that the settlement (which amounted to a slap on the wrist with a wink and a nod) was likely leaked before it was announced, I think we covered this. So a lot of those positive divergences may be left overs from the settlement with the SEC. The only thing I see that is at odds with the market is a 1 min negative divergence on several 3/4C charts. Here's one-

The red boxes show negative 1 min divergences in MoneyStream, TSV and 3C-this is at odds with the markets behavior and GS reports in the a.m. It appears the Specialists are reducing their inventory before the earnings... why? You'd think if GS was going to pop that they'd want to have accumulated supply to sell? right? I don't know, it's a little mystery, but this is what we have to work with, however expect GS to be  fulcrum of the market tomorrow, as in "as GS goes, so goes the market"-at least for tomorrow to some extent. Keep an eye on this one. After all the accumulation before the SEC news, if earnings/guidance disappoint, then there could be a lot of sellers lined up-and institutional sellers at that.

Do HOG owners love their Hogs more then their savings? 
The easy answer to that is probably yes. I didn't do exhaustive analysis on this one, just a quick look as they are reporting Tuesday and it looks like HOG may very well come in with some good news that the market can sink it's teeth into. Like I said, this was a quick look but it appears to be fairly positive. The thing that makes HOG interesting is that its price position is so close to changing the downtrend, it just needs to get above $25.50 and it will have changed at least one trend from down to up, there could be some room for the bulls there. We'll know soon enough.

DAL took it on the chin for a bit today before the market thew it a lifeline, UAUA reports tomorrow, so more of the same? Is the industry just not in good shape? It wouldn't surprise me. UAUA has a strange triangle top, it's (cyclically  speaking) in the right spot for a stage 3 top (distribution) and although DAL had a different top, it too is stage 3, so there may be an opportunity tomorrow for the nimble to catch a quick move down like a few members did with DAL today. Otherwise, it may be a worthwhile trend trade.

A double bottom-3C showing accumulation there and as I have said-accumulation occurs on light volume-this is Stage 1. Stage 2 mark-up is confirmed with 3C and the triangle top shows signs of distribution and a false breakout, most likely in stage 3, next stop=DECLINE

BIIB
Reports in the a.m., this stock is not looking good. My guess would be that it will not do well over the next few days. Although it has had a significant rally in July, it appears at best 3C confirms the trend in in a few instances the daily chart is in a negative divergence. It reports in the am and while the SPY saw price confirmation at the 3 p.m. rally high, BIIB sold off, so there was 3C relative weakness which without doing an hour work up/analysis on the stock, I can only take it to mean that the results will not be well received.

Now for some questions I didn't answer yet....
USO-this chart is in a consolidation, a big one and the most likely resolution is the preceding trend which is down. I only make 3C calls when a divergence jumps off the chart and is extremely obvious. If I have to search for it, I pass it by. USO is one that I would pass by, 3C is not giving any strong signal which could mean it's in some transition, So next I fall back on the price/volume of the chart which I mentioned, right now it's in a downtrend that is consolidating so I'd guess, besides a false breakout, the path of least resistance is down. However that's a 60/40 call and not a high enough ratio that I would put money into the trade. There are thousands of opportunities, the trick is to find the highest probability trades, USO right now is low on that scale. A break above $35.50 or below $33 would change the dynamics and then there may be a worthwhile trade there but right now I'd just put it on a watchlist.  The typical correlation with the $USD is not strong right now, I suppose it's because currencies are in such upheaval and our government is so out of control with spending that every other country is calling for some other currency benchmark.

Bottom line, until something happens, skip it.

Look for updates tomorrow. If we do get the gain in market prices, it's not something I'd be concerned over. The drop on Friday was enough to put the market into an oversold condition in a single day so there's bound to be some correction, It's when sentiment is so bad, we will see the market forget about oversold and just dump. We are getting closer to that as Friday proved.

Last, if you are not getting updates via email and want them, please let me know.

When we get back into a decent trend and less of this seesaw volatility I will post trades again to the spread sheet. Right now though there's a ton of window dressing and volatility due to opposing forces, on one side we have political/ Fed interests (or surface interests from the Fed) and the other, what the market really wants to do, they are fighting day and night and institutions use that volatility to scare people out of positions set false breakouts and make everything worse and more volatile. This is not a good trading environment unless you can sit in front of a screen all day, then there's some money to be made, otherwise, sticking with the prevailing trend is the best option. They say don't fight the Fed, but there's so much more to that story nowadays then ever before, it's just not a hard rule like it used to be; nothing is anymore-just look at the correlation that used to exist with the VIX-it was reliable-now... it's like a kid scribbling on paper. Correlations are quickly disappearing and rules that use to be hard and fast are fading fast. Like I have been saying, this is a new market and it isn't easy but you need to understand how it works and I hope I can help with that as I learn more every day myself.


In any case, if there's one time you don't want to actively trade, it is during earnings. Why? The whole idea of what we do is to put probabilities on our side and then and only then commit. Earnings (unless we figure this out with 3c in a manner in which we have a strong edge) are a wild card that kill probabilities. That doesn't help our cause and it would be irresponsible of me to feed you some trades just to make it look like I'm doing something. That is not a good investment of your membership and I won't do that unless the probabilities are overwhelming. That said, there are a few ideas people made some money on today, just don't swing for the fences , okay?

Monday, July 19, 2010

Feels Like Something's Coming Out

There are several positive divergences on the 1-10 min charts . Nothing goes straight down and we had a bad plunge last week, keep an eye out for news soon. I don't see any threat to the overall bearish trend assumptions, it's just again, getting from A to B and we are on the last leg of that trip.