Tuesday, March 29, 2011

USO Update

As you may be aware, we were looking for a pullback in USO, nothing bearish, just a normal correction.

 Here was one of the targets, so we have hit it. I also had a secondary target closer to $40. Whether this is it for the pullback or not, I' not quite sure, in the bigger picture I don't think it matters much, but there is some evidence to suggest this may be it for the pullback and USO is getting ready to try to break the March highs.


 The 15 min pullback reversal signal and a current positive relative divergence.

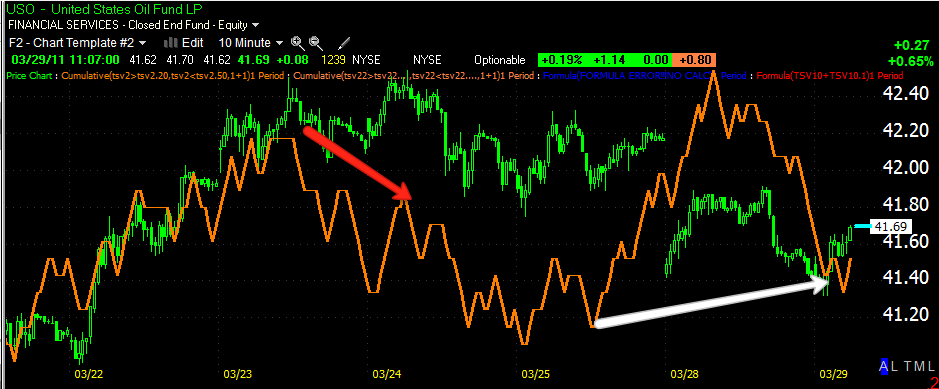
 Same thing on the 10 min chart, except a bit more defined.

 Ditto for the 5 min chart.

And some accumulation between late yesterday and early today which is moving USO higher.

From the evidence and initial targets published last week which have been hit, I have to assume the probabilities are highest that the pullback, which was not expected to be a big deal, is over.

Fundamentals Are Bad This A.M.

The Consumer Confidence Board missed, also the inflation rate index climbed to the highest levels since Oct. 2008.

The Case Shiller report shows what we already knew, housing is in a double dip recession.

Meanwhile traders are in the market on some of the highest margin ever in high Beta Stocks,  a very dangerous position especially given all of the Fed presidents speeches which are taking on a very hawkish tone finally. Today it was Bullard in the beautiful city of Prague suggesting that 2011 will likely be the year the Fed will start unwinding accommodative policy.

All in all, not much to be bullish on.

AN IMPORTANT LESSON

Last week on March 24th, the following was "leaked" to Zero Hedge via a European trading desk. This is what the market looked like on the close that day.

You may recall, this was Thursday of last week. My first post in the morning on Thursday outlined what I expected to see in the market for the day and Friday, at which time I believed distribution would be complete for this bounce. After hours that dat, RIMM posted earnings that had the stock decimated in after hours. There were still many stocks and important indices that needed to break price patterns and resistance, "The by now, proverbial false breakout" .

So here was the release: 


"Something rather disturbing from a European trading desk...
TODAY TWO LARGE MACRO FUNDS OVER HERE HAVE GONE WILDLY LONG S&P. NOT LONG. WE TALKING 250% NET LONG. IT LOOKS LIKE CONCERTED ACTION ON GDP DGRADES FROM GS AND BOFA ARE THE LETTER DELIVERED TO BEN ON QE3. HUGE DIRECTIONAL BET WITH NEW CAPITAL PUT AT WORK. MOST LIKELY THE TWO INSTITUTIONS ARE COORDINATING ACTION WITH OFFICES IN CONNECTICUT. CHECK INFLOWS OF BLUE CHIP HEDGE FUNDS IN JAN FEB. APPLY 2.5 LEVERAGE. WE ARE TALKING ABOUT SOME 40-60BN PUT AT WORK PRIMARILY ON EMINIS AT THE MOMENT. WHETHER SOME EXTERNAL FORCE WILL LEAVE THEM HIGH AND DRY I DON'T KNOW. BUT IF ANYTHING SEEMED TO BE AT LEAST NOT TOO IRRATIONAL UP TO NOW, IN THIS THIRD WAVE, BE READY FOR REAL ROCK AND ROLL. "


Emotionally I was a bit worried about it being I was calling for the end of the bounce, rationally I knew this is the exact kind of thing Wall Street does to juice the market that extra notch when they need to make a target and things look to be slipping.

As this was releases after hours, the ES/S&P trade went nuts with a lot of volume and quite a move up. This I knew for sure was retail traders, pros don't accumulate in the thin after hours market, they don't accumulate into rapidly rising prices and they don't make it obvious to traders. What was going on was clear, even though there was still that conflict between emotion and rational thought. Friday was up as expected per my Thursday morning post. And in fact Friday seems to have been the top as yesterday we closed lower with a lot of selling into the close which continued this morning most likely all retail action reacting to yesterdays late afternoon trade.

By now I hope the point is sinking in. Wall Street hides their hand and when something like tis is revealed, it's done so for a reason. This time many people who chased the S&P in after hours got left holding the bag. It's even less of a surprise that it happened right before quarter's end.

The point really is that these kinds of manipulations have to be looked at rationally. Price action shows up in one place more then any other source and that's on a chart. A chart is objective, it's transactions that are complete, not rumors. I imagine this won't be the last time we see this kind of nonsense in the market so next time you see something out of the ordinary like this, don't be too quick to swallow the bait. It's the primary reason I don't watch CNBC, everyone there is selling a story. Most of all, react rationally with hard information that you have at your disposal.

I'll most likely put out a video later today covering this in greater depth, but I hope the rumor, the false breakouts, the window dressing and all of that reach you and help you understand what the market truly is.  It's not a level playing field, there are few if any friends and a good trader is always skeptical if not downright paranoid about what they hear.


Monday, March 28, 2011

Window Dressing and T+3 settlement...

This week, Wednesday precisely, marks the end of the quarter. So before quarter's end we usually see window Dressing or the "Art of looking smart" as managers get rid of dogs that didn't perform and buy leaders that did, even if they only held it for a week before quarters end, their prospectus will show "XYZ winner" as a stock in their portfolio for the previous quarter and prospective clients can look at "XYZ winning stock" and come to the conclusion that this fund was in the right place with asset allocation, it's a real scam, but it happens the most at year end, then quarter end and even at month's end as more funds are reporting to clients monthly results.

What is T+3? Here's the official explanation from the SEC In essence, it means the last day for these transactions to take place to make stocks appear or disappear from the fund's portfolio would be today.

Which brings us to this afternoon's sell-off and volume.

 As you can see by the daily closing volume, today's volume was weak

However, at the end of day when Wall Street is most active, take a look at the volume, a huge increase. Had volume been similar to the last hour all day, we'd have more then 2X the closing volume and to make matters more important, the volume up until the close, had it held today's trend, would have looked more like this...
About a 3rd less and one of the lowest volume days since last year. In other words, the increase in selling before quarter's end settlement was huge and to the downside. I think you can draw your own conclusions as we move forward.

BRCM Update

BRCM was an idea from Feb. 28th

There have been several follow ups and a recent look at adding or initiating a position short BRCM

It appears BRCM is ready to resume its next leg down.

 15 min chart

The downtrend...

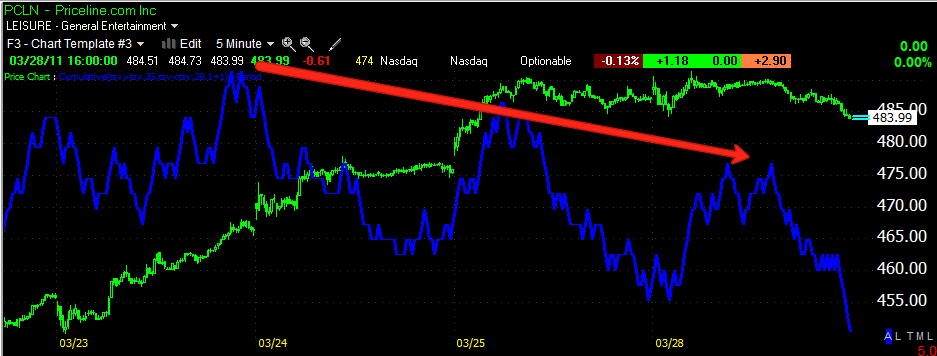
Another Bellwether Taken Down-PCLN

 A Dark Cloud Cover Daily Reversal Candle formation

 5 min chart fell apart quickly

 As did the 10 min.

As I've said, the 15 min chart usually takes some time to fall apart but today it lost a lot of ground quickly. It seems that distribution was quite strong as many charts are showing the same thing and worse on the 15 min charts. AAPL was another.

GOOG lost 15 points in an hour

SLV set to follow in GLD's tracks

Reversal Upon us?

Well the AAPL bomb scare in the Sacremento Campus would certainly be an event that would allow the locals to start the downward process, sometimes news is beneficial to them.

Take a look at the charts, they are what I expected to see Friday.

 A typical daily candlestick reversal pattern.

 SPY probably reacting to the scare at the AAPL campus. Support is broken and on volume!


 5 min 3C/TSV charts looked really bad today...

 The 10 min chart looks horrible

 And here's the 15 where most reversals happen, it really went downhill fast today.

And the TICK chart showing how bad it is in the market.

QQQ Intraday Breadth Charts are starting to get ugly

Maybe tonight f I have time, I'll post on the daily breadth charts, until then, here are the Q's intraday breadth charts falling apart.

 % of stocks above and below their 5 min 50 bar moving averages.

 5 min QQQ advance decline line and ratio

Intraday momentum index and breadth below.

Translation, more stocks are starting to deteriorate then strengthen while the Q's sit at the unchanged level.

***I have to run down the street to the Dr.'s office, should be back in 30 mins. or so.