Friday, July 29, 2011

DIG/DUG

Anyone remember the game?


DUG on this 15 min chart looks close to a reversal.

That would mean DIG would be the trade.

The End of the HOV Story

I should have included this chart...
We see the 2000 leading positive divergence/accumulation and this on a 5-day chart! There was one brief negative divergence in 2002 that led to nearly a year of flat prices (red box), but largely the trend was confirmed (green arrow) by 3C making higher highs with price, that is until the 2005 top. Again, this is one chart, but I've studied this case thoroughly and can tell you there were plenty of distribution signs.

The market -The Real Market

So we are moving back up a bit, basically I think it's on news that Obama will consider a 2-day extension on a short term deal.


However, does anyone find it strange that short term accumulation in the IWM and then the SPY preceded this announcement  by as far as I can tell, at least 90 minutes in the IWM and about the same in the SPY?

I personally don't think 3C would work very well if it were not for Wall Street quietly acting on non-public information while the masses are focused on negative price action.

I hearken back to the home builders accumulation during the 200o tech bear market. First of all, I think most everyone thought the next bull market would again be led by advances in Tech, secondly, there hasn't been much of a historical precedent for a housing boom leading a bull market. Housing typically appreciated by low single digits or so in most areas. So was it a lucky guess? If it were, they were sure darn committed to the guess.

Take a look at HOV during the 2000 bear.

 HOV weekly accumulation. I've studied this period extensively, I use the weekly chart for convenience.

 Here's HOV vs. the NASDAQ 100 in 2000, the yellow area is HOV's accumulation zone of nearly a year.

 Here's the decline in the NASDAQ 100- nearly 83%

And HOV's climb, 2482%

I'd say someone had some pretty good information about the housing boom that took off in 2003. Some suggest that Fed policy was more or less a gift to the banks regarding housing to make up for losses during the tech meltdown.

A year or so of solid accumulation in housing, way before anyone knew housing was gong to prop up the entire economy through the last bull market? Unlikely it was a lucky guess or superior analysis.

SRS Trade Update

In This post I updated the SRS stop

We knew resistance was coming up and it might be a problem, so here's some new charts/stops and info.
 Here's the resistance, and I can see a pullback from here.

 Here's the original stop, which will still keep you at breakeven at the worst.

 This stop is a bit tighter.

10 mn negative divergence upon crossing resistance, suggests SRS pullback and load up for the next leg up.

SPY Update

The SPY has finally broke from near perfect confirmation of today's price action to a positive 1 min divergence, echoing the earlier IWM positive divergence intraday.

I Had To Do It

I just couldn't resist after seeing this under the title of "Summarizing the Negotiations in D.C"

Link

On the Turkey Story

Apparently the link didn't work, lets try again.

IWM

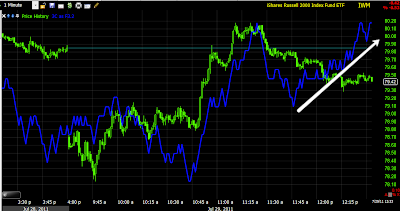
The IWM 1 min is looking like it is preparing for its next intraday leg higher.

This is the exact same chart as above, I'd like to get some feed back as to which size you prefer. TIA.

MENA Revolts Spread to Turkey?

Article Here

Revisiting QE2

In this post a couple of nights ago, I outlined and summarized why I've been bearish. I made the case that Quantitative easing was little more then a golden parachute for the insiders at major corporations and did nothing for the economy. Now we see the Q1 revision a mere half a point away from a recessionary quarter, and this is while QE2 was in effect.

Here's the GDP trend

Only Q1 of 2009 hit 5% and that was revised lower, you can see the trend after revisions. In fact Q1 may be even worse after the next revision, Q2 will certainly be worse and the trend is likely to continue down. In fact, with revisions, we may find out that Q1 and Q2 were both running below zero and two consecutive quarters of sub 0 GDP=recession. As for Quantitative Easing, I think this chart speaks for itself.