Tuesday, August 30, 2011

Why is Gold Up Today-3C Didn't Show Positive Divergences?

Some of you may be wondering this.  One explanation s simple, when the market has been down, Gold has been a safe haven trade, still there wasn't much of anything to show GLD would be up today, here are the charts...

 GLD 1 min is even in a negative divergence with the lift this a.m.

 GLD 2 min showed no hint of a positive divergence, although I'm kind of surprised given there were hints in most everything else, maybe GLD was just slated to head lower and give up it's Safe Haven status.

 The 5 min chart showed confirmation of the move down at best, currently GLD is negative even though it is up.

Here's the recent cycle we played on the upside and when it ended on a 15 min chart, again no hints of a positive divergence.

So what's the answer....

This was posted at 8:30 a.m. today


Fed Dove Evans Open Mouth, Demands More QE, Sends Gold Soaring


The story is linked, but there's your answer. This type of move is usually short lived, if Wall Street feels there is more then a day or two of upside in it, they will bring GLD down and accumulate it as this was a surprise announcement that they couldn't have accumulated for in advance. However, I doubt that happens, it will likely be a flash in the pan and GLD will head lower over the next few days.


Treasuries

Treasuries paint an interesting picture....

If you read my post last night on the direction I thought the market would be taking, including being down today, then you may find these two Treasury ETFs interesting as they more or less fit with the observations from last night. Understand that I'm not a bull or trying to make a bullish case, I'm a realist who happens to see the longer term picture in a very bleak light, but I've lost a lot of respect for a certain web-site that I have whole-heartedly agreed with in the past, however their Perma-Bear attitude I find distasteful and when the market was up yesterday, their whining about it I thought was out of line. I want to inform my members and when the market is bullish, I'm not going to whine about it because I have a long term outlook that differs. I want to bring you the market as it is without biases and prejudices, bullish or bearish.

Here's last night's post which picked up on several of the themes from yesterday, if you haven't read it already, I would suggest you do, then this post will make more sense.

We know that one of the safe haven trades can be found in Treasuries, so I look at, compare and contrast two long term Treasury ETFs, 1 a bullish 20+ year, the second a bearish 20+ year and find some interesting parallels with the market and what has thus far been my opinion on the market moving forward.

Lets start with the Bullish Treasury that is a flight to safety trade when the market is down, TLT. We'll start with the longer term charts, that have more importance when it comes to the bigger picture and end with the short term charts which show imminent moves, but do not necessarily have much to do with the big picture, but more to do with what is right in front of us today or over the next few days.

TLT 20+ Year Treasury Bond Fund-the Safe Haven Trade (click on the chart to enlarge)
 TLT 60 min shows what appears to be a trend reversal with a negative divergence at a top and the recent leading negative divergence as it approaches stage 4 -decline. This is not a healthy long term chart in any way.

 TLT 30 min, this too shows the same exact thing, from the top to the leading negative divergence in the red box.

 TLT 15 min, there was some earlier confirmation at the green arrow, yesterday we saw some late day accumulation by way of a leading positive divergence, but so far this morning's action is NOT confirmed, and at a negative divergence on the move higher in price.

 The 5 min chart shows some accumulation several days ago and some slight accumulation in the morning yesterday, but that could also be attributed to 3C simply heading down and not moving fast enough to catch up with the gap down yesterday on the market's strength. Currently today's action is NOT confirmed, but rather in a position of a negative divergence.

 The 1 min chart showed nothing yesterday, no real divergence at all-this is backed up to yesterday's close.

 Forward the 1 min chart today and you'll see again that between two relative points, the first much lower in price and the higher price today, 3C is still in a negative divergence.  The main point being there hasn't been a lot or much at all in the way of underlying strength building in to this move higher on a flight to safety and the longer term shows a bleak outlook for the safe haven trade. This fits well with my analysis and my developing opinion on where the market is heading.

Now... TBT UltraShort the 20 year Treasury. This is the opposite of the safe haven trade and should move up when the market moves up and vice-versa.

 While we've seen weakness in the past months, August has shown a long term 60 min positive divergence, just like the major averages and many of the man industry groups. In fact, we even have a positive leading divergence here.


 The 30 min chart is similar with another current leading positive divergence-remember that leading divergences are the strongest and you can see why they are called leading as price is near the lows on this chart, while 3C is near or at the highs of this chart, even compared to when price was much hgher in months past.

 The 15 min chart also has a leading positive divergence.

 The 10 min chart, much like many of the averages I showed you, shows a negative divergence, I believe this is what sent the markets lower today as the 10 min timeframe was a common theme last night for the negative divergences in the market.

 If I back up the 5 min chart until yesterday's close, you can see the 5 min positive divergence. toward the end of the day, we saw much the same n the major averages yesterday.

 Roll the 5 min chart forward to today and even the drop is still in a positive divergence thus far, although it s still early.

 Here's the 1 min chart rolled back to yesterday-note the positive divergence and remember what I said last night about any negative divergences in the market yesterday were getting steam rolled, but they accrued on the 10-15 min charts.

Roll the 1 min forward to today and even with the drop, it's still, thus far in positive territory.

If you read and understood last night's post, then this post should compliment the findings from last night's and many of yesterdays with respect to my market outlook.

Daily Wrap-Short Covering...

When I talked about the market facing a sharp sell-off on Wednesday August 17th, there was a rationale for that. Here again is the article that forms part of the basis of my ongoing and evolving market expectations.

Theory on How Op-Ex Friday Fits In to the Big Picture

Here's an excerpt from that article,


"but if Wall Street creates a SHARP sell-off between now and Friday, they wipe out most of the call contracts, the holders of Put options may be more likely to exercise their Puts then sell them if they see such a sharp sell-off. The long term 3 has been bullish, so f next week Wall Street runs the market up then the exercised Puts will be in a short squeeze and they effectively knock them out too on a Sharp rally."


Today I mentioned that some of the action we saw looks exactly like short covering. And wouldn't you know it, as I had said earlier that the markets had retraced about 38.2% of the drop that started the next day after the Fed met with the Primary Dealers for a conversation that we are still in the dark about, this is a Fibonacci retracement that shorts would love to see to re-establish short positions. The sell-off on Thursday would do nothing but cement the shorts convictions that the market bounce was over and we'd be headed to new lows on Friday and through this week.


That was a big part of my Op-Ex research. The deal situation would to have the market sell-off a bit, all the calls with any significant open interest were wiped out and holders of Puts would likely exercise those puts and enter a short position thinking the next leg down had started rather then only collect a fraction of what the contracts offered as of the close on Friday. The move up today would put the squeeze on these exercised puts.


Today the NYSE releases short interest data and low and behold, short interest for Aug 15th was 1 billion shares higher then two weeks earlier at the end of July, the biggest bi-weekly increase since March of 2009! Add to that the shorts are in the market at near historic margin debt and the market moving up all of the sudden has a new meaning of "MAX PAIN" as margin calls role in. This is what was expected in the article above from August 17th.


As I mentioned earlier today, this has been a hard month to stick by the signals of 3C when everyone and everything is bearish, but stick by it I did as this isn't the first time I've had to make a controversial all. By my way of thinking, the 3C call s already a success, how much further it takes us will just add to that.


Look at the market today, we had some bad news, for example, Pending Home Sales dropped 1.3% on consensus of 1%, the market didn't turn around and head down. The Dallas Fed Index dropped -11.44% from -2 on consensus of -9, but the market still didn't look back.


The market's ability to absorb bad news and keep chugging ahead is completely characteristic of Wall Street running a cycle they have set up more then a month n advance, it cost them a lot of money to accumulate and they are not taking a loss, the train rolls ahead. 


Although volume was light today as it has been for awhile-another sign of short covering, NYSE up volume outpaced down volume by a ratio of 12:1.


The dominant Price/Volume relationship was Close Up/Volume Down, just like Friday's except for the Russell 2000 where it was the most bulls of the 4 relationships, Close Up/Volume Up.
This is the price pattern we are dealing with, this particular pattern has a bearish technical outlook and is expected to break down, today's break up must have caught a lot of shorts off guard. The red trendline I drew n is the point of pain for shorts, the higher the market rises above that trendline, the greater the losses on short positions and the more record margin interest margin calls will be coming is. I had expected the probability of a downside head fake first, but we didn't get that and probably didn't need it, the next most probable head fake would be a move back into the triangle telling technical traders t was a false breakout and inviting them to short again, a subsequent move higher will cause all the more damage.


As  said, 3C call is already a huge success when you consider this is where we were when it started calling for a bottom and upside from there...
At this point in time, very few people thought that we'd see any kind of a short term bottom until the S&P hit the 1000-1050 area. 


Should the market cause the short squeeze I think it is still capable of, targets could range from $125 in the SPY easily and as high as the $130's!


As for tomorrow, will we get more short squeeze action, a pullback, a consolidation?


Here are the charts, many times today short term negative divergences were just run over as the market headed higher, but there's the likelihood that those accrued in the longer term charts.


The most likely path for tomorrow? I believe it is some downside and possible that head fake we've been pondering. Remember, if it doe come to a head fake, it's going to look, taste, smell and sound real, there's no point in a head fake that doesn't inspire confidence in the shorts, so just beware of that fact upfront. Here are the harts that lead me to this conclusion...


DIA


 Now working from shortest to longer timeframes, this is the 1 min with a negative divergence.

 The 5 min -negative divergence

 The DIA 10 min s where I believe today's run-over negative divergences accrued and it's a pretty sharp negative divergence.

 The hourly chart still looks bullish as well as the 1 day chart.

IWM
 Here's a bullish daily IWM chart.

 The 1 min -negative

 IWM 2 min -negative

 IWM 5 min -negative

 The 15 min is very bullish in a leading positive divergence-so a head fake makes sense, otherwise if we were to just head to the next leg down, the 15 min chart wouldn't look so good.

QQQ
 The daily QQQ s one of the most bullish of the averages, it's nearly leading positive.

 QQQ 1 min-negative

 QQQ 5 min-negative

 Again, it seems the run over short divergences that were negative accrued on the 10 min chart

 Even the 15 min is negative, interestingly intraday, the Q's look like one of the worst averages, a strange dichotomy.

 The QQQ 30 min chart is very strong in a leading positive divergence

SPY
 A strong daily SPY chart...

 The 1 min SPY is inline, but kind of wedgy.

 The 5 min is inline

 The 10 min picks up on the negative divergence

 As does the 15 min chart

 The SPY 30 min looks strong

 And the SPY hourly is leading positive, again, another reason I think a head fake could be severe, but we still have the important charts pointing to more upside.

VXX
 The VXX trades inversely to the market and showed a positive divergence all day today, this is another reason I think we will see weakness tomorrow/days ahead.

 However the 5 min chart didn't go positive, so it doesn't suggest a huge reversal or anything like that and VXX is still a good swing short in my opinion, it my be even better after tomorrow.

The bigger picture of the VXX on an hourly chart looks like a downside reversal is locked in place.


As for other indications...
 The FXE (Euro) showed some late day strength, but was t enough? I don't think so, not yet anyway.

 The 5 min chart is in a leading negative divergence, which means the Dollar should look stronger.

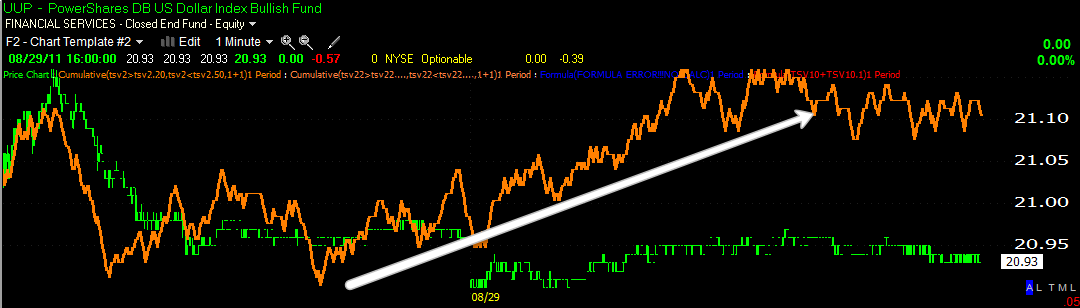
 Here's UUP ($USD) 1 min in an all day positive divergence, if the dollar goes up, that will weigh on equities and the energy complex as well as commodities.

And the 30 min UUP chart looks fairly positive as well.


All in all, the charts seem to argue for a head fake move, one that may have you wondering about whether the market can really put in more gains from here, but remember the long term signals and the record margin and high short interest, it's all there for Wall Street to take it away and I believe that this set up has been in the works for at least a month. 


We'll see how the charts develop tomorrow, but so far, I am resting a lot easier after a few hard weeks of sticking by the 3C calls.


See ya n the a.m.