Saturday, September 3, 2011

TEST

Friday, September 2, 2011

3C Calls and Portfolio Positioning

This is a $100k model portfolio that I have very little time for, but I wanted to show members that all of the information in the 3C calls can be used to trade effectively. No trades are placed until the update appears here first and very often I don't have time to even place the trades unfortunately. I also have to deal with  15 min delay, so when I see an optimum entry that you can trade immediately, I have to wait 15 minutes, often loosing the great positioning.


However, 3C has been right on the money, especially through this very transitional and volatile time.

Any way, there are 6887 portfolios, some are MIT students and other business schools that are competing.

Here's this week's ranking...

#10-the top .02% of 6887 portfolios with nearly a 60% return this week.

This isn't meant to be bragging or taking a victory lap, it's meant to show what you can do with risk management and the information contained n just about every post on the Wolf on Wall Street site.

I hope you had a similar great week!

Best Guess For Tuesday

 SPY 1 min accumulation-seems like there could be a gap up on tuesday that may allow for better positioning on shorts.

 The 10 min chart shows the same positive divergence, but in the middle of a bad leading negative divergence, suggesting the same as above.

The 30 min chart is downright ugly with no improvement today. Remember, nothing goes straight up or down, so I plan on trading  around this a bit, but maintaining the bulk of my shorts for now.

Taking some profits

As I mentioned in one of my last posts, I'm going to take some profits and hope to get better positioning to re-establish shorts at a better level, maybe today, but most likely Tuesday a.m.

DTO position update

 DTO 1 min seems like there's some more intraday upside here... but

 The 10 min chart is not in line with price and a bit negative.

 So is the 15 min chart.

 The 30 min chart suggests more upside, so I think we may see some short term volatility that may take DTO a little lower, then up after a day or so, I'm guessing at this point. I intend to at least reduce my position there to lock n a profit.

 As for the dollar, there's a short term negative divergence, which means some selling pressure, that seems to indicate that USO will see some upside and probably explains some of the DTO intermediate negative charts.


 The 15 min chart is inline.

The hourly chart seems lke the dollar is headed higher, which should help DTO in the longer term.

Market Update

 DIA 1 min- can't say 'm surprised to see a positive divergence here on the break of the triangle-remember-volatility around important support areas.

 DIA 15 min also shows some longer term accumulation, I think this is institutional money taking advantage of the short seller volume.

 DIA hourly seems to suggest there's more downside to go in the bigger picture, although we may see volatility as I mentioned last night, both intraday and on a daily basis.

 IWM 1 min-same as above.

 IWM 5 min is in line with the downtrend

 So is IWM 30 min-suggesting more big picture downside.

 QQQ 1 min-same as the DIA 1 min chart finding.

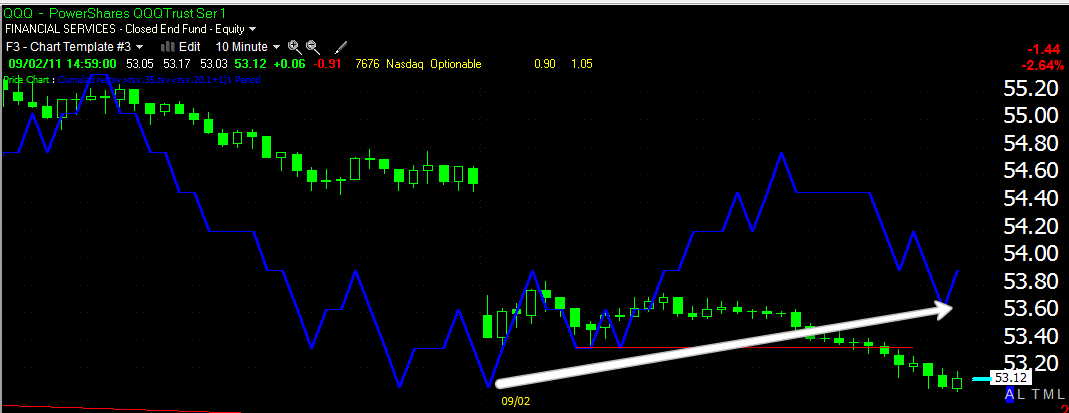
 QQQ 1o min -same as the finding on the other chart-institutional money taking advantage of the volume from short sellers.

 QQQ 15 min is in line with the downtrend.

 QQQ 60 min-we are close to breaking the triangle here, but not like the SPY and DIA which already did. This chart is leading negative-big picture suggests more downside.

 SPY 1 min-same as all the other 1 min findings-volatility around important support.

 SPY 5 min is in line with the downtrend.

 SPY 15 mn-same finding as all of the others-institutional money accumulating the short seller volume in my opinion.

SPY 60 min, big picture suggests more downside.

Addendum

I should have added the possibility of a bounce at triangle support, being it' an important level. Look for volatility in price around this area.

Plan is working-Short Sellers are taking the bait

Remember, the triangle is what all retail technical traders are watching. It broke out to the upside, so it seemed to be a solid pattern. My call for a move down included a break of the triangle, this would tell retail that the triangle breakout has failed and technical analysis teaches them to reverse positions (in this case go short) on a failed technical pattern. THIS IS WHAT WALL STREET WANTS! They need the short sellers to enter the market so they can squeeze them on the next cycle up. This is a perfect example of what I mean when I say Wall Street adapted to Technical Analysis and uses it against technicians, but technicians still after 10 years have stuck to the dogma of technical analysis and have not adapted to Wall Street, making technical trader's actions predictable, which makes Wall Street predictable.


 This volume spike is on the simple break of intraday support, the diagonal line is the top of the triangle. Short sellers will really enter the market in droves on the break of that support and a failed triangle-at least that's what they think.

 Here's the daily chart and how close we are to that failed triangle. The short seller volume will make it that much easier for Wall Street to accumulate in the wide open as someone has to take the other side of the trade, it raises no suspicions!

On an intraday basis, here's how close we are to breaking the triangle! PERFECT!

As For Emails

I pride myself on answering emails in a timely fashion, today I've had a lot and the response time is not what I would like, but I have a lot to watch in the market for the whole Wolf Pack. So if you have an email that can wait until after market, I'd appreciate it if you sent it then. If you have something that needs to be addressed right away, please mark the subject line as "Urgent" so I know I need to get to it ASAP, some of these posts like the last one took nearly an hour to put together, but I think it was important information for everyone to have.

Thanks for your understanding...

USO update

It seems like the 12:36 pot about re-entering USO short worked out.

 USO has moved lower since I re-entered the short on strength intraday.

The 1 min chart looks like a little bounce or consolidation is coming up. I do expect more downside though as far as the intermediate term goes. If we get a bounce here, t may be a chance to enter USO short.