DIA 1 min- can't say 'm surprised to see a positive divergence here on the break of the triangle-remember-volatility around important support areas.
DIA 15 min also shows some longer term accumulation, I think this is institutional money taking advantage of the short seller volume.
DIA hourly seems to suggest there's more downside to go in the bigger picture, although we may see volatility as I mentioned last night, both intraday and on a daily basis.
IWM 1 min-same as above.
IWM 5 min is in line with the downtrend
So is IWM 30 min-suggesting more big picture downside.
QQQ 1 min-same as the DIA 1 min chart finding.
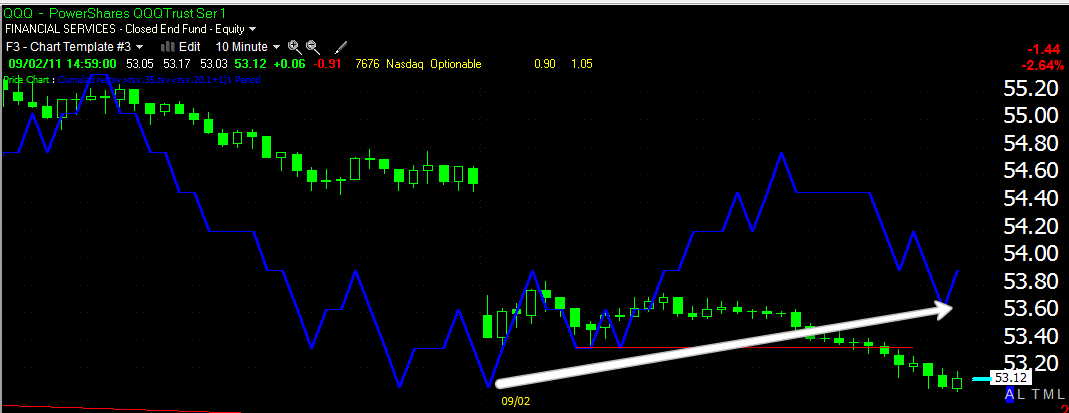
QQQ 1o min -same as the finding on the other chart-institutional money taking advantage of the volume from short sellers.
QQQ 15 min is in line with the downtrend.
QQQ 60 min-we are close to breaking the triangle here, but not like the SPY and DIA which already did. This chart is leading negative-big picture suggests more downside.
SPY 1 min-same as all the other 1 min findings-volatility around important support.
SPY 5 min is in line with the downtrend.
SPY 15 mn-same finding as all of the others-institutional money accumulating the short seller volume in my opinion.
SPY 60 min, big picture suggests more downside.


 | Theme by Thur
No comments:
Post a Comment