Friday, October 14, 2011

Market Update

 DIA 1 min longer term view with a leading negative divergence on the day

 DIA 1 min close up, the DIA 1 min never really showed the accumulation the other averages saw, it just floated with then, there was an afternoon brief period of accumulation, but on the day, there's a steep relative negative divergences as price is in the same area as the open. This is why I said earlier, I would consider phasing in, getting my toes wet, but leave room for any additional upside to short in to higher prices.

 DIA 2 min shows accumulation but 3C is dropping in to rising prices, which is what we want to see when shorting higher prices.

 QQQ 1 min long term view

 QQQ 1 min short term view, accumulation and trading in line with price.

 QQQ 2 min is seeing negative divergences in to higher prices.

 The 15 min was able to use today's price strength to add to the size of the negative divergence, although zoomed out, it has been in a leading negative position.

 SPY 1 min accumulation areas.

 SPY 2 min like the others, showing negative divergences in to higher prices, again what we want to see when shorting in to higher prices
.
 SPY 5 min showing the same

 And today's gap up also provided the SPY an chance to put in a deeper 15 min negative divergence, which was missing in the SPY.


ES made that new low and then went lateral for a bit, as prices have moved up, 3C has started lower again

GLD Update

 As many of you know, I have been talking about an opportunity to buy GLD that only comes around a few times a year, that is a pullback to the 150 day moving average. This time unlike other times over the past year or two, GLD was taken down pretty hard to the 150 m.a. and as such, I said that I think it is best if GLD consolidates along that moving average for several weeks, being the way it arrived at the average was a steep plunge. The declining volume is a sign of a consolidation, however recently it has pulled up and away from the m.a. which is not something I'd prefer to see until GLD is healthy enough to make a run higher.

 GLD 1 min 3C chart -Some recent updates I've noted GLD pulling a bit too far away from the long term moving average and showed a negative divergence suggesting it would fall a bit, which it did at the orange arrow, however not for long as accumulation started and it has moved higher today-it doesn't know if it wants to move as a flight to safety trade or as a week dollar trade, it keeps moving back and worth. Today's price action has run into some resistance and there has been a negative divergence on that.


 GLD 2 min 3C chart the 2 min chart shows the same accumulation as above from yesterday morning and a negative divergence today, which is slight really.


 GLD 5 min 3C chart Here we see the negative divergence suggesting the pullback we saw yesterday and today again it's a bit negative,


 GLD 10 min 3C chart This hart remains negative as long as it is away from the moving average.


 GLD 15 min 3C chart the red line is the moving average area and we see a leading positive divergence here, not quite as strong as the one that lifted prices from the near lows.


GLD 60 min 3C chart-The hourly looks a lot like a consolidation, however, the more it pulls away from the moving average, the more apparent distribution we see. For a healthy consolidation, we want to see accumulation here and I don't think we see that in strong measure while it is off the 150 day average.

USO/SCO Update

So muh for supply and demand moving the market in general and Crude oil in specific, is it OPEC? Is it Tensions in the Middle East and Africa? Is it the Iranian plot to assassinate a Saudi diplomat right here in the US that is moving oil? NOPE! Just adjustments to the dollar.

USO
USO 1 min chart expanded view-The recent divergence here is leading negative, even at new highs

 USO 1 min chart close up-shows us a negative divergence on the open, a slight positive divergence around mid day sending USO higher intraday and since a leading negative divergence.

 USO 2 min chart  A longer term negative relative divergence and some accumulation sending USO higher today.

 USO 5 min chart expanded view-There's a lot here -the red and white arrows are the same I use for 3C divergences, the green and orange are rallies and declines that resulted from the 3C divergences. September a negative divergence sending USO much lower, but there was heavy accumulation into the decline as marked in white with a leading positive divergence sending USO higher. Several short divergences moving USO intraday and a current, very ugly 1 day leading negative divergence. This would imply there's heavy distribution in to the gap up today which also broke a closing resistance level at $33.25 which may be a head fake move/bull trap.


 USO 15 min chart -This long term view shows 3C cause and effect from divergences, again with orange arrows representing price declines, however, like I explained earlier about the market and SPY, there's a long term positive divergence of accrued accumulation that allowed USO to really turn upward on a dime without the need for a "U" shaped bottom to accumulate. Currently this chart is in a leading positive position, partly as a function of the amount of accumulation that went in to this current leg up. There is a relative negative divergence on USO today.

 USO 60 min chart -The hourly chart shows a much less optimistic picture, being a longer timeframe, it s a more important chart, it doesn't give us the same detail as the 15 min, but does show what is a relative (longer term) negative divergence, again this is a function of the long term 15 min accumulation, it's a lot of shares that were accumulated by Wall Street and a lot that need to be distributed, thus we are seeing a 60 min negative divergence and today specifically it has gone leading negative which would imply the price strength is being used to distribute-either selling or short selling.

SCO-UltraShort Crude Oil
 SCO 1 min 3C chart expanded view- a longer term 3C positive divergence


 SCO 2 min 3C chart -Shows several positive divergences in a base like atmosphere including the very common and likely, head fake/false breakdown/bear trap- as SCO broke resistance today, but maintains a positive 3C profile, most likely any stops that were taken out were accumulated as this is one reason for the head fake/false moves.


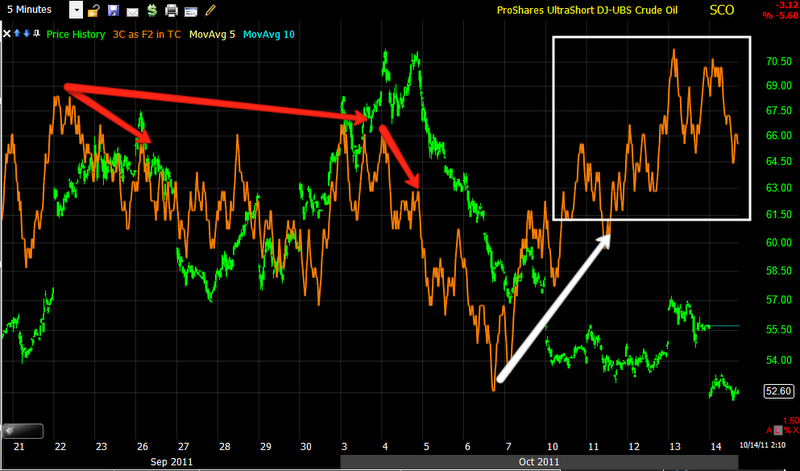
 SCO 5 min 3C chart 0Shows the topping of SCO as well as what appears again to be a base with a very positive leading divergence

 SCO 10 min 3C chart -positive divergences

SCO 15 min 3C chart  positive divergences on an important reversal timeframe.

USO/SCO Update

So muh for supply and demand moving the market in general and Crude oil in specific, is it OPEC? Is it Tensions in the Middle East and Africa? Is it the Iranian plot to assassinate a Saudi diplomat right here in the US that is moving oil? NOPE! Just adjustments to the dollar.

USO
USO 1 min chart expanded view-The recent divergence here is leading negative, even at new highs

 USO 1 min chart close up-shows us a negative divergence on the open, a slight positive divergence around mid day sending USO higher intraday and since a leading negative divergence.

 USO 2 min chart  A longer term negative relative divergence and some accumulation sending USO higher today.

 USO 5 min chart expanded view-There's a lot here -the red and white arrows are the same I use for 3C divergences, the green and orange are rallies and declines that resulted from the 3C divergences. September a negative divergence sending USO much lower, but there was heavy accumulation into the decline as marked in white with a leading positive divergence sending USO higher. Several short divergences moving USO intraday and a current, very ugly 1 day leading negative divergence. This would imply there's heavy distribution in to the gap up today which also broke a closing resistance level at $33.25 which may be a head fake move/bull trap.


 USO 15 min chart -This long term view shows 3C cause and effect from divergences, again with orange arrows representing price declines, however, like I explained earlier about the market and SPY, there's a long term positive divergence of accrued accumulation that allowed USO to really turn upward on a dime without the need for a "U" shaped bottom to accumulate. Currently this chart is in a leading positive position, partly as a function of the amount of accumulation that went in to this current leg up. There is a relative negative divergence on USO today.

 USO 60 min chart -The hourly chart shows a much less optimistic picture, being a longer timeframe, it s a more important chart, it doesn't give us the same detail as the 15 min, but does show what is a relative (longer term) negative divergence, again this is a function of the long term 15 min accumulation, it's a lot of shares that were accumulated by Wall Street and a lot that need to be distributed, thus we are seeing a 60 min negative divergence and today specifically it has gone leading negative which would imply the price strength is being used to distribute-either selling or short selling.

SCO-UltraShort Crude Oil
 SCO 1 min 3C chart expanded view- a longer term 3C positive divergence


 SCO 2 min 3C chart -Shows several positive divergences in a base like atmosphere including the very common and likely, head fake/false breakdown/bear trap- as SCO broke resistance today, but maintains a positive 3C profile, most likely any stops that were taken out were accumulated as this is one reason for the head fake/false moves.


 SCO 5 min 3C chart 0Shows the topping of SCO as well as what appears again to be a base with a very positive leading divergence

 SCO 10 min 3C chart -positive divergences

SCO 15 min 3C chart  positive divergences on an important reversal timeframe.

Market Update

And we have the intraday bounce 3C was calling for, lets take a look....
 The 1 min chart was showing a positive divergence, meaning an intraday bounce and that has come, so far there's a bit of distribution there, but it's too early to say if this leg up intraday is done, however I personally would consider adding or initiating some short here,  for a new position, getting my toes wet and leaving room for any more possible upside. 


 The 2 min finally went positive as the 1 min was positive for so long it creeped in to the 2 min. Right now trade is inline with 3C on this timeframe.

 The 5 min remains in a leading negative divergence, whether we get more upside or not, will be determined by the 1 and 2 min charts, but a move lower (yellow arrow) on the 5 min 3C chart would not provide a very supportive intraday environment for more intraday upside.

 The 15 min stayed nice and negative in to the bounce, again, moves lower here will be highly suggestive of a high probability turning point for the market.

This is 1 min ES (you have been seeing 5 min-which is still negative) and it also showed positive 1 min divergences intraday which the market responded to, and a current negative divergence that for now has halted the intraday bounce.

EVERYBODY HATES PCLN

I tell you honestly, if there is 1 stock that I get the most questions about shorting, it is PCLN. I can't be sure, but with that much animosity toward the stock, I'm guessing people either lost some money there or just see it as being way overvalued.

The interesting thing is the "Rising Tide Lifts All Boats"  general rule of thumb, in which most stocks follow the market up or down, rarely applies to PCLN as it is off doing it's own thing in both directions.
Today PCLN is up .19% as of the capture a few minutes ago, while the QQQ is up 1.09%

I'll try to fit PCLN in an update later.

Market Update

 SPY 1 min still positive and still looks like it is building for an intraday bounce, however markets can also correct laterally through time.

 The 2 min remains negative, so the 1 min positive divergence is not migrating to a stronger timefrme.

 The 5 min is quite negative with a bad relative negative divergence between the Wednesday intraday highs and today. There's also a leading negative divergence in play on the 5 min chart, thus this is looking like a decent area to add/ or initiate short positions. It would be best to do so on price strength (an intraday bounce) that is confirmed to be under distribution.

ES has now moved in to a leading negative divergence (in an early update I told you it was approaching that area). You can see a bit of Wednesday's market hours toward the close in black at the far left, Thursday's in black in the middle and today's regular market hours. The white arrow is the 3C positive divergence from early a.m. hours that sent ES higher in to the American market open, since the negative divergence has continued and is now leading negative as 3C is lower then the area where ES went positive (the white arrow) creating a leading negative divergence. It is also  at new lows for the entire chart timeframe, even though prices are higher, showing negative underlying action. Scrolling back, I see this is also the lowest 3C reading for the entire week!

Sector Rotation

The Sector Rotation map of the main 10 industry groups is interesting given the market gap up. As you can see, Financials at the bottom in green have fallen way off and are underperforming other groups dramatically. HealthCare (gold)  is also moving lower along with Industrials (purple) and Staples (yellow). The only groups to seem to be in rotation are Tech, Basic Materials and of course Energy because of the move lower in the dollar. The fall in Industrials and Financials should be monitored via the S&P and Dow-30. The Q's  as expected by the sector rotation map, are outperforming the rest of the market, being up +.86%, the SPY +.70, the DIA +.59 and the IWM +.33 and nearing unchanged.


 This move up in the Euro and move down in the dollar has a nearly perfect correlation with the market and is the cause of Energy/Crude moving higher. However, these parabolic rallies rarely last long before correcting.


Which is what the Euro is doing now.


Furthermore, it seems there are some US concerns that are starting to gain on European concerns as you can see the 1.0 correlation between the Euro (FXE in red above) and the market (SPY green above) is a bit weak today with the Euro making a new high and the SPY flat at the former high, refusing to follow the Euro to a new high.

Intraday Market Update

We should be seeing an intraday bounce higher shortly...
 SPY 1 min positive divergence

SPY 2 min negative divergence and currently in line.

Being only the 1 min chart is positive as of now, it shouldn't be too major of a move, but it should produce some intraday lift.