Monday, November 7, 2011

Treasury Confirmation

Treasuries trade inversely to the market, when the market falls there is a flight to safety trade in to treasuries, so treasuries should look roughly like the mirror opposite of the market.

 Just as the market shows us bear flags, treasuries (via TLT 20+ year) shows us a bull flag, formed well with correct volume in to the flag. Also at a breakout point as market bear flags are at a breakdown point.

 The 1 min TLT is showing a negative divergence intraday as the market shows intraday positive divergences so this is pretty good confirmation.

 However the TLT 2 min chart looks much stronger then most market negative divergences.

As does the 10 min chart, all of this still suggesting an intraday bounce as the longer term trends like the 10 min chart remain very bullish for treasuries and thus bearish for the market.

Intraday bounce

 DIA 1 min

 DIA 2 min shows some signs of a positive divergence

 QQQ 1 min has a leading positive

 As does the 2 min, the Q's look the strongest.

 QQQ 5 min is in line, no divergence

 SPY 1 min positive divergence

SPY 2 min is inline looking the worst of the 3.

The sooner the move starts, the smaller it will be, if it keeps accumulating the larger it will be. Still it's only on intraday timeframes.

All the flags

Bear flags are consolidation/continuation patterns, they trend up in a flag like consolidation and then break to new lows continuing the downtrend that preceded them. They are also highly visible on a chart and are almost always manipulated in the short term. According to technical analysis, a bear flag (when it breaks out of the flag) should break downwards, however Wall Street knows that is what technical traders are betting and trading on so they almost always break the flag out to the upside first, which shakes out the shorts that entered short because of the bearish pattern, then to add insult to injury, technical analysis teaches that if a pattern fails, you should reverse your trade and thus go long the failed flag, of course that's about the time that Wall Street lets the flag break down as it was supposed to do the whole time. This is the typical day in and day out manipulation of technical traders that has been going on for over a decade. I do remember when these patterns worked as they were supposed to, but back then technical analysis wasn't very popular either. In any case, the bigger the technical pattern, the more likely it will be manipulated, but also the more likely it will do as it was supposed to do in the first place at some point. Watching for the false breaks can often give you an edge and better positioning on your trade.

 Here is the DIA's flag, different then the SPY, but a flag.  This is as clean of a flag as you will probably see, it has broken below the flag and as normal, tested the lower channel (resistance). There was no significant volume on the DIA break of the flag. The Dow-30 showed a little more volume, but that was on the way to breaking down, not quite on the break.

 Here's 3C during the DIA flag, showing a negative divergence sending price from the top channel to a break down below. On the Dow-30 it is this divergence and move down where the larger volume is found. You can also see a negative divergence on the test of resistance (the lower flag trendline) suggesting that too will fail.


 Here's the QQQ's flag which is manipulated not once, but 3 times, maybe 4, You can see volume pick up as the longs sell when prices re-enter the flag at least 2 times.

 Here's the 15 min QQQ 3C chart for the flag, negative at the first major break, again like the DIA's divergence, volume picked up here and the second negative divergence leading to a negative leading divergence, volume picked up here as well. Why do they do this? Because the earn money on the bid /ask spread by creating events that traders will buy or sell, anytime volume increase, so does their pay day via the bid/ask spread and volume rebates-the more volume they send to their clearing house, the more of a kickback they get in the way of volume rebates.

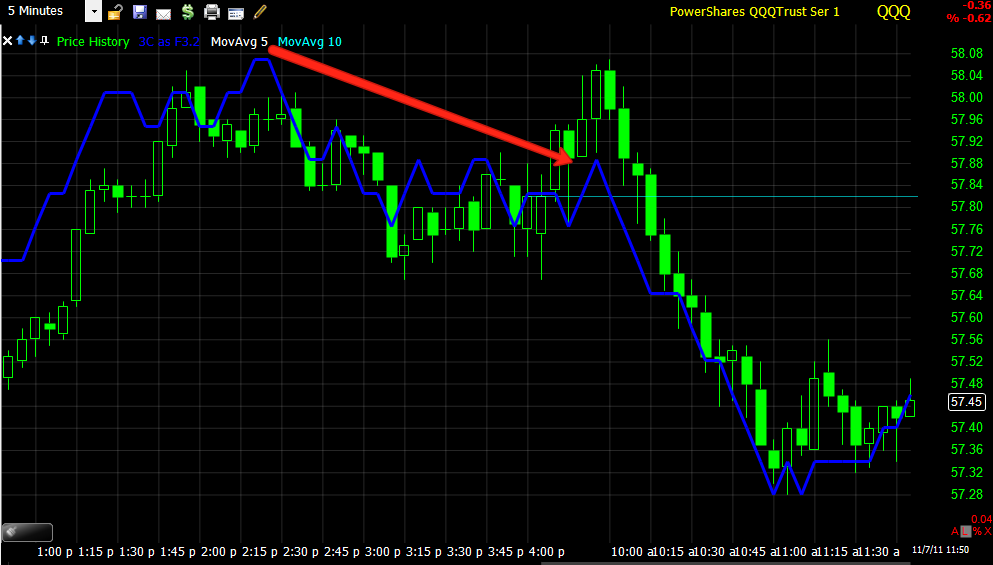
 Here's the QQQ 5 min showing the last divergence from late Friday and leading negative today, the QQQ should find temporary support at the bottom of the flag and should break below the flag, I would guess with the activity already in the Q's, volume will increase.

Here's the SPY double flag I showed earlier, which I showed the divergences as well, not much of an uptick in volume, but it was there.

The environment right now is technically deteriorating.

Flag of a Flag

 Here's the area of focus, the top area from the October rally, which formed a failed bear flag, which formed another small flag below it.

 This is a closer view of the region.

 Here's the 5 min 3C chart, negative at the top of the rally, negative at the top of the first flag and leading negative at the second smaller flag.

 Here's the 2 min chart of the negative divergences at the larger and smaller flag.

And today's 1 min chart of the smaller flag.

ES Trade

It looks like overnight low volume accumulation in ES with a negative divergence coming in to play just as the higher volume regular market hours begin.

ANOTHER VOLATILE DAY AND WEEK AHEAD

Maybe we should just call it another month or quarter. What initially seemed like bullish news with G-Pap agreeing to step down in exchange for a unity government in Greece was quickly glossed over and attention focussed squarely on Italy this weekend with the market wanting to see Berlsculoni step down, why?

Here is Berlsculoni at the G-20 summit
Other then the beautiful blue background, the other thing of note is he is sleeping and had to be awaken several times just as Italy was being discussed. Furthermore he refuted rumors of his stepping aside this morning via no other news source then his TWITTER account! Obviously from the ECB's communique this weekend, most feel he is not up to the task and whether he steps down or is forced out will create a lot of volatility in the markets this week. Italian 10 year note yields were hitting all time highs this morning of 6.6%, close to the levels that brought down other PIIGS. Despite Draghi's weekend warning to stop buying Italian bonds if the government in effect, "won't help itself", apparently since stepping in to the role of head of the ECB, he has doubled purchases of Italian bonds, yet they still are hitting all time high, making Europe's 3rd largest economy the domino that could pull the entire house down.

Jefferies which has released their European sovereign debt holdings several times over the last week to show there are no problems and they are not the next MF Global, somehow managed to dump nearly 50% of them since the close on Friday, this really has the feel of the 2008 era when banks said they had no more subprime exposure, just to write it down again over the next 4 quarters or until they were taken over by the government.

As for volatility in the commodities space, the MF global accounts that have been transferred to smaller to midsize brokers have been transferred with ZERO capital allocation, it appears only CME got money, so if you were a MF Global customer, you got a margin call today for the full amount, if it is not met by the EOD today, accounts are liquidated, while all CME customers enjoy a 30% discount on margins across the board on any new positions, it's like a tug of war and should lead to, well who really knows what. It's odd that the smaller brokers with less resources to issue margin calls and liquidate accounts got zilch in margin money from the MF Global trust, but I guess it's good to be the king or CME.

So it looks to be another week in which trade is dominated by rumors, rebuttals and confidence votes.

Yet as the Wall Street Journal pointed out today, Merkozy made a huge mistake in saying at the G-20 that any country is free to leave. That puts unlimited risk on Euro bonds and likely will do nothing to attract investors in to the EFSF fund, which even the Germans will not pledge their gold as collateral. 6 weeks ago they said they would do anything to save the Euro, now, not so much.

Volatility may abound, but the end of the story seems pretty clear.

Sunday, November 6, 2011

Wikileaks Exposes What the Real German End Game May Be

Here's the communique from 2010

Changes in Character Precede Changes in Price Trends

Between my 4 charting platforms I must have over 1000 technical indicators available and the ability to build another 1000 or more, sometimes we get lost in these indicators and forget that one of the best indications of a change in the market is a change in the character of the market. Mass sentiment is a good reflection, but in days like this when news is so abundant and fast moving, sentiment can change literally by the moment.

I've found the same to be true with technical indicators, especially in times of chaos, they are chaotic.

In fact, last Friday I used 3C and a simple, but rare bearish candlestick pattern (a visual representation of sentiment used for hundreds of years by the Japanese) to make a call that the markets would likely fall on Monday, that is what happened, even though I spent most of the weekend looking at traditional indicators and had I gone by them, I would have never said the market would fall Monday. I have found in times like this, taking the long term view is about the only thing that really works, and indicators can work as well, but they need to be set to a longer term view.

 My Trend Channel is not like other channels that are set to fixed settings, it automatically adjusts, widens and narrows according to the stock's recent volatility. I use it as a longer term stop, especially for trends, but it is also helpful in identifying changes in character. Above on a daily setting, it first showed a short position stop out in white and suggested the trend would change to up, after a volatile move outside of the channel, which I consider to be bearish in most cases, even though it looks bullish, the channel then gave a sell signal in red, weeks before the market actually crashed. Then it gave the all clear with another white (cover signal) suggesting the downtrend was done for now, which it was. It recently gave a sell signal on Tuesday of this week. Additional changes in character include this week is the first week of the last 5 weeks that we have seen a weekly close at a loss, the last 4 weeks all posted weekly gains, suggesting a change of character is underway. This is more or a broad sword then a scalpel, but it is effective for it's purpose. It will never take you out at the top of a long trend or the bottom of a short trend, but it will allow you to catch the 60-80% of the trend in the middle, which most people simply use arbitrary stops and leave a lot of profit on the table. After all, if you have a 6 month uptrend, fear may cause you to take profit in the first few weeks, the trend channel makes the decision for you based on the stock's own changes of character and allows you to have an objective stop.


 Here we see price in a bear flag this week, just like I showed you in yesterday's post, we saw a similar bear flag in 2008 at the same area. Right now price is caught between resistance of the major Head and Shoulder top's neckline resistance at the red arrow and recent consolidation support at the white arrow. There is almost always short term volatility upon the break or breakout of any important resistance or support level, so this area has the potential for volatility.

 This is the S&P candlestick pattern, a bearish reversal Harami Cross, which is quite rare to see, that led me to say (a week ago from this Friday) that I thought the market would be down on Monday.

 This Doji in the SPY on Tuesday shows a loss of momentum and indecision and led to to say that I thought we would see a bounce from there (this Tuesday)- the bounce formed a bear flag which Is showed you appeared in 2008 at almost the exact same time and level in an extremely similar pattern-see my last post on the market "Follow Up 2008/2011 Market Action"

 The standard technical tools, including MACD would not have suggested any type of likelihood of a Monday/Tuesday decline. The 50 day average also shows what will likely be an important support level in blue.


 This 3C shows the recent weakness in the bear flag this week.

 The 5 min chart shows the Friday area that looked very much like a top area, the second divergence is the bear flag from this week. The leading divergence is hitting new lows right now on this hart.


 I have over the years, used StockFinder's BackScanner function to test many of the most well known technical set ups and signals and have found that they have almost no edge over the market, they are just cherry picked examples put in the newest Technical Analysis book and rarely, if ever, have back testing data to support their use. One such indication is the "Death Cross" or the "Golden Cross" which is the 50 day moving average crossing below or above (respectively) the 200 day moving average. Backtesting this strategy has shown no usefulness whatsoever. However, one thing I have observed at nearly every major and minor bull market top (changing to a bear market) is the 50 day crossing down below the 200 day, but the 200 day must be close to or already be pointing slightly down. Above is the 2008 top showing this feature and recently around late August 2011 we have seen it again. As I said above, as with almost any breach or breakout of an important support or resistance level, there is volatility nearby and you can see the bounces to the 200 day moving average in both cases after the cross has occurred (at the yellow arrows).

 Looking at more tops, here is the S&P breaking down at the 2000 tech top, the direction of the 200 day average is very slight, but it has a slight downward bias to it.

 The Dow-30 1981 top shows the same.

 In 1976 there was a cross below the 200, but notice the trajectory of the 200 was up, in 1977 there was another cross, this time the trajectory of the 200 was slightly down and there were several tests of the 200.

 In 1971 there was a false cross and 1973 a real one with the 200 starting to move down as well as several volatile tests of the 200. You don't have to use a microscope to determine the 200's direction, usually the false signals it will be clearly facing up while the real signals it will be facing slightly down or at least flat and confirm the down move shortly thereafter.

 Here's the S&P 1969 top with a false and real signal, note the trajectory of the 200 in each (white and red boxes).

 The Dow in 1946 was quite clear, it led to a sideways/lateral market for years, note the false signals during that lateral market.

 In 1938, we have another perfect example of the false cross and the real cross.

Finally in 1929, the cross was quite obvious as was the bear market rally to the 200 day.

Determining the exact direction of the 200-day average can sometimes be challenging and leave the door open to subjective/emotional interpretations, however, I have found that is you add a 100 day moving average to the 200 day moving average (not to price), the 200 day average will often cross below the 100 day average in an environment that may be otherwise difficult to determine the direction of the 200 day average.

 Here's a close up of the recent cross below the 100 day average and I have created a kind of MACD of the two averages to show the actual cross below. As to the effectiveness of this strategy...

Here's a long term view of the results, it called every top and bottom, removing the uncertainty of bear market rallies or bull market declines. The 200 top is called, the 2003 bottom is called, the 2008 top is called, the 2009 bottom and recently this week another signal of a 2011 top.

Here is my Trend Channel's performance during some of the most well known bull market tops in the last century. A setting of 5 days handles shorter term trends, a 9 day setting handles longer term trends and a monthly setting gives the trend the most leeway possible, a break below a monthly Trend Channel Setting (as far back as the last century, has always ended up being a market top.

 Here we see the widest setting of the monthly trend channel, it calls the 2008 top; in the white box there was a top-ish looking area after QE1 ended, a shorter timeframe may have called it a top, but the monthly timeframe allows for this period to remain as part of the longer term uptrend, only recently in August did we see a break of the monthly trend channel. Note also how well it hold the uptrend from 2003-2008-not a single false signal.

 Here's the NASDQ 200 Tech bubble top , both the uptrend before and the downtrend after are held well within the channel. While a shorter timeframe could have been used to have an earlier signal, the monthly timeframe is fairly definitive.

 The minor S&P 1976 top, even though there is volatility after the signal is given, the top is still assured and this is on a 5 day basis.

 The S&P 1969 and 1973 tops as well as the 1970 bottom, again, shorter timeframes, especially for the bottom would have produced earlier signals, but the monthly timeframe again throughout the century has been definitive.

 Dow-30 1946 top leading to a lateral market.

 Dow 1937 top, also look how well the channel held the preceding uptrend and the proceeding downtrend.
 The 1929 top on a 9-day basis, it holds the uptrend for several years before calling a top and all of the downtrend.

On a monthly setting it holds 9 years of uptrend without a single false signal, the top is signalled a little later, but with the change in volatility between 1922-1928 vs 1928-1929, the channel can and should have been set to a shorter timeframe as a change was underway clearly indicated by the price trend, thus giving us the earliest signal possible.

In essence, the length or setting of the Trend channel depends on what kind of trader you are and the market conditions. I have used 5 min version for day trading, after several years of uptrend, I would choose a longer setting as a clear trend is in effect. For swing traders a 60 min to 1 day setting may be appropriate, the important thing is that the Channel adjusts its width as price volatility changes, so it is unique to each individual stock.


ICE/CME Margin Adjustments

I bet you never thought you'd see the day when either of the two actually lowered margin! That's exactly what happened this weekend, at least with respect to initial margin, a drop of nearly 30% ACROSS THE BOARD!

The reasoning?
As MF Global customers are transferred to other brokerages, only about 60% of the margin money is available from MF accounts to go along with those customers, so some may not have to put up additional margin, some will get margin calls. Since many can't afford the extra margin and would be forced out of positions, the initial margin is being lowered across the board, which includes equity futures such as ES.

The odd thing is that they made the cut across the board rather then specific to MF Global accounts only, which will likely have the opposite effect of what was intended, a smooth transition with minimal disruptions to the futures market, to everyone now being able to put on new positions at a significant discount with regard to initial margin.

It's hard to say what effect this will have as the typical short to long ration in equities in 1:9 but in futures it is 1:1 as most futures traders open a long position they have an offsetting short position as well.

What does seem to be a problem causing excessive volatility is having all of these new positions put on at a discount, obviously they won't all go as the traders have planned and may disrupt or change the amount of maintenance margin calls that go out, thereby creating excessive volatility in the futures market as margin calls are not met and the positions are instead liquidated.

Why in the world CME/ICE didn't limit this to MF Global accounts only is beyond me. The measure is said to be temporary, but most of the accounts will be transferred within the next few days, yet they don't give a timeline, this could cause excessive volatility early in the week as non MF-Global customers seek to take advantage of the lower initial margin rates, not knowing how long the party will last.

Here's CME's clarified statement on the new margin rates.