Monday, November 21, 2011

USO Update

 The USO daily chart with a bearish ascending wedge that started on the first 3C negative divergence, it also is the place in which Crude/USO broke it's long standing correlation (inverse) with the $USD in what is now appearing to be one of the biggest head fakes I've seen in USO, unless there is still an underlying fundamental reason that we are unaware of ( like plans for Israel to attack Iran). With very simple volume and candlestick analysis, the top in red was called a "top" on that day, large volume and the inability for USO to close any higher then it opened suggested large scale bearish churning, or institutional money dumping their shares to dumb money, who are now at a sizable loss.

 Here is USO compared to the Euro, it should track nearly identically, again you can see where the long standing correlation was broken, the same spot as the original 3C negative divergence and it is where the bearish ascending wedge started to form.

 On an intraday basis, the Euro has rallied, pulling commodities or at least crude up a bit off the lows as the correlation should.

 The long term moving average defining the trend has been broken to the downside on increased sell-side volume, much of it likely from buyers trapped at the $39+ level.

 The 1 min 3 hart has gone from slightly positive to slightly negative.

 The longer term chart shows accumulation that started the USO uptrend in white to the left and distribution throughout the bearish ascending wedge, the exact reason these price patterns form. There is some recent 15 min. strength and for those who want to add to USO shorts or want to establish a new position, we may get a good, high probability/low risk opportunity soon. Just as I never chase longs out of greed, I don't suggest chasing shorts out of greed, a little patience will often get you the exact position you want.

 Here I can see the probability for USO to move at least to the 10-day yellow moving average, that would be an "okay" entry on the short side, but not a great one.

 A 50% retracement of the fall, would make for a good entry near $38.50 for 2 reasons, the 50% retracement being the first, the kiss of the ascending wedge's apex "good bye" being the second, this would offer a high probability, low risk short side entry and chance to add to a USO short through leveraged inverse ETFs like SCO or DTO.

 The 30 min chart, which is more important because of the longer timeframe suggests massive distribution in USO, which means to me, if I'm holding a short in USO, I don't mind letting USO rally a bit to add to my short or start a new short at better, less risky levels. The fact the 30 min chart is so negatively divergent gives me some comfort in holding my current USO shorts or in starting a new short position as the distribution seen on this hart is very serious and points to much greater downside risk in USO, so a counter trend rally for me is a chance, not a concern.

 The short term 2 min SCO (UltraShort Crude) chart has seen a few counter trend moves on negative divergences, I would hope to see a deeper pullback then the last negative divergence to add to this position or DTO or if you don't have a trade on, it is worthy of consideration as a new trade once it gets in to a bit less risky position with much higher probabilities of success.

As for SCO, the 60 min chart has had a solid bullish crossover on my custom screen, a pullback to the $40 level would be an area in which I would start paying attention and looking for an entry (long SCO/DTO --- short USO).

Market Update

 Without taking the unnecessary time to load up my own credit models, I will simply refer to the CONTEXT model which shows clearly that despite the market's need to stage a counter trend bounce, the RISK basket continues to leak lower, diverging with ES/S&P-500 market action, now hitting the worst levels of the day as the market looks to bounce intraday.

 The model in green and ES in red.


 Meanwhile on a longer term scale, the daily chart of the QQQ on my custom crossover screen, that uses 3 different indications including 1 custom indicator in the middle window to avoid false/whipsaw crossovers that plague crossover systems, is now giving all 3 sell/short signals on the QQQ, the S&P, Dow and R2k aren't far behind. Typically after the initial move and signal, we often see (at least in individual stocks), an attempt to retrace price back to the yellow 10-day moving average in the top window, whether that happens here or not depends on how badly the market has actually broken. Before a serious break, like the 2008 break, the market will typically retrace, however once we have hit the point of no return, this is less likely to happen and as in 2007 and 2008, it took the market about 16 months to lose over 54% which ended up being 10% lower then where the 2003 rally started. 16 months to erase all gains and then some, where the market took 4.5 years to build those gains.

When the market hit the point of no return in 2008 after the 2007 Head and Shoulders pattern broke (note the 2011 head and shoulders pattern has been broken just this July) it took precisely 7 months for 47% of that 54% loss to be realized. The point being, markets fall much faster then they rise and even when a top develops and breaks, there is a point of no return in which the losses and the pace of the losses are accelerated. Furthermore, typically the market beta is around 1.5% for stocks on average, meaning a 50+% decline in the S&P-500 translates in to a decline of over 75% for a majority of stocks themselves and that is not using any leveraged ETFs like the SPXU (S&P bear ETF 3x leveraged).


 Here's today's intraday pattern, a narrow inverse Head and Shoulders bottom, that has already broken out at the white box on a slight increase in volume. The pattern implied target in around the green trendline near $120, however news and momentum traders could alter that target.

 Here is the very useful 10 min Bollinger Band which went from exceptional volatility to a pinch at the green box, which implies a highly directional move from that flat volatility zone.

As a barometer of the market, the 50 ema (exponential moving average) on a 60 min chart has held the October rally very well and a break below this average is what we have been waiting for as a sign that the October rally top has broken, here you can see price has made a significant break below the average and it only took a few days.

What Matters, What Doesn't

Yesterday I said the Spanish election of the opposition party (the 3rd major transfer of power in 2 weeks!)  may see the same sugar rush market bounce that the market saw when this happened in Greece and Italy, UNLESS other events overtake that.

Well as predicted yesterday, Spain's Rajoy won the election in a landslide as Spanish bonds started hitting the insolvency level and Spanish voters panicked. The problem in Spain as well as Italy and Greece, the newly elected or in some cases like Greece, not elected, technocratic governments who promise reforms and thus give the market a 1-2 day sugar rush rally face uphill struggles and almost insurmountable challenges as firstly reforms take years to implement and see results, secondly, reforms sound good to voters when they are panicked, but when the actual reforms come, the voters revolt against them as we saw in Italy last week. Italian voters were all too happy to rid themselves of Berlusconi and put their future in the "responsible hands" of a Goldman Sachs advisor (add him to the Goldman Sachs former employee now running the ECB-which makes one wonder when Sarkozy will be replaced with a GS alumni?), but the minute he started promising reforms which included reducing the retirement age, taking-NOT TAXING, BUT TAKING .60% of all privately held Italian bank accounts and re-introducing a tax on properties that had vanished, the Italians were in an uproar and remain so. The last point is similar to the first, reforms have no chance in terms of time and results when put up against the bond vigilantes that send countries' debt yields over the 6-7% line, in which debt becomes unsustainable and the countries are faced with a default, which sent Greece, Ireland and Portugal all racing for a bailout, but at 4 times the combined size of all 3 formerly mentioned countries combined, there are no bailout funds left, even if the EFSF could be funded, it did not allow for enough money to bailout a country the size of Italy. Other then that, they need to leverage the fund up by a trillion dollars and thus far have had to buy their own debt in secret to make what was supposed to be an EFSF $10 billion dollar debt auction (which was then reduced to a $3 billion dollar issuance) not seem like the total failure it was. So $3 billion down, a trillion to go and no money for Italy or Spain!.

As mentioned, the Spanish election sugar rush could be overtaken by events in the EU, but we would not know until 3 a.m. EDT when Europe opens and I already showed you the overnight ES chart and the negative divergence before Europe opened that sent the ES lower.

And why? Take your pick of the following events:

In the USA: 
"Washington's most ambitious effort in years to come to grips with its mounting debt is set to end with a whimper on Monday as negotiators plan to announce they have failed to reach a deal.
The Republican and Democratic leaders of a 12-member congressional "super committee" are set to declare defeat in a joint statement to be released after three months of talks failed to bridge deep divides over taxes and spending.
Super committee members said they are still talking, but they were not hopeful of a deal.
"I wouldn't be optimistic. I don't want to create any false hope here," Republican Senator Jon Kyl said on Fox News. He said the panel would release a statement by the end of the day."


A REAL downgrade of France and not just a rumor this time?


Ratings agency Moody's believes the recent rise in interest rates on French government debt and weaker economic growth prospects could be negative for France's credit rating, newspaper Le Figaro on Monday reported the agency as saying.
France has a top-notch triple-A rating. On Oct. 17, Moody's said it could place France on negative outlook in the next three months if the costs for helping to bail out banks and other euro zone members overstretched its budget.
As I have mentioned, the real barometer of risk can be found in French bonds as they ARE NOT eligible for ECB intervention like the Italian and Spanish bond markets, what you see is what you get with France. Today the French 10-year yield rose by 14 basis points to hit a very high (for France) yield of 3.61%, this IS contagion moving from the PIGS and straight into the Core.
Spain hit 6.57% today, very close to the 7% mark that sends countries in to a tailspin and as I noted last weekend, Spain has been long ignored, but they are about to comeback into the limelight, little did I know it would happen the very next day.
Even with EB intervention, Italy hit 6.75% and is moving bak toward the high above 7%, new government be damned.

China...
As I talked about last week, the notion of a Chinese "soft landing" is undercut by the real facts on the ground and the pieces of the puzzle that are easily assembled, despite what the opaque government says. Commodities were one of the first signs that China may in fact be in trouble.
"A senior Chinese official, Chinese Vice Premier Wang, said yesterday that a ‘chronic’ long term global recession is certain to happen and China must focus on domestic problems."
Another way to read that is the EU can forget about China investing in the EFSF. Or that commodity action has indeed shown us an early sneak peek of trouble in China. A third way to read that can be taken from this news piece from Reuters...
Wang said an "unbalanced recovery" may be the best option to deal with what he had described on Saturday as a certain chronic global recession, suggesting Beijing would bolster its own economy before it worries about global imbalances at the heart of trade tensions with Washington. (Or in other words, Obama's recent chiding of China, such as telling them to "behave like adults" because of the massive distortion in the US/Chinese trade surplus, is now going to take a back seat to a "China First Policy")

His comments suggested that Beijing should attend to bolstering China's own growth before it worried about global imbalances. In other words, a strong Chinese economy that brings a continued trade deficit with the United States would be better for the world economy than a slowdown in China itself.

"The one thing that we can be certain of, among all the uncertainties, is that the global economic recession caused by the international financial crisis will be chronic," he was quoted as saying by the official Xinhua news agency.

China's growth slowed to 9.1 percent in the third quarter from 9.5 percent in the second-quarter and 9.7 percent in the first quarter, but the rate remains in Beijing's comfort zone. (All Chinese propaganda aside, the numbers are probably much worse, but shows in fact that China has seen 3 consecutive quarters of decline and now they are VERY concerned about what they call a "Certain chronic global recession", this as well as commodity trade highlights the fact that the Chinese economy which is experiencing its own real estate crisis right now, is in a lot more trouble then we realize)

Out of Europe today...
"These are very challenging times... The sovereign debt crisis has re-intensified and is now spreading over to other countries including so-called core countries. This is a new phenomenon,"

We know France is infected, but what about the final man standing, Germany?
(Germany's) Bundesbank slashed its 2012 German growth forecast to 0.5%-1% from its previous forecast of 1.8%, sees German economy entering 'difficult waters' in the coming months
I think the question was just answered.


EU's Rehn said that the sovereign crisis is hitting core Eurozone countries, and there should be no illusion

"T
his is not news to anyone, and certainly not to European banks, which have seen their deposits with the ECB (or a safe haven for any cash within the European interbank system) rise at the fastest rate in years, if not ever, since the last MRO. It has taken just 11 days to go from €73 billion on November 8, post the most recent LT liquidity operation, to €237 billion. We expect the total to surpass the two years high of €300 billion in under 5 days."


Market Update

 DIA short term small leading positive divergence, otherwise, largely in line.

 The IWM looks the worst, it is pretty much in line with a minor relative positive divergence this afternoon, but the market usually moves together.

 QQQ leading positive divergence.

 SPY 1 min leading positive divergence

5 min SPY is in line, suggesting an intraday bounce and not much more. I suspected this would happen as the losses were so big off the open, it was unlikely the market would simply hold them without some counter trend movement.

The NYSE TICK chart has also went from a downtrend this a.m. to the start of an uptrend, suggesting a bounce.

Intraday Bounce?

I'll post 3C next...
 Commodities are slightly outperforming, this is largely due to a stronger Euro recently and weaker dollar, but may pull the S&P up.

 Here is the Euro bouncing late this morning, the fact stocks have not followed is interesting, but I would expect some movement toward the Euro.

 Here is that bounce in the EUR/USD on an FX chart.

 Financials drug the S&P lower earlier, now they are outperforming a bit and may drag it higher in an intraday bounce.

 Here High Yield Credit drug the market lower in the white box, , but the market is moving a little higher then HYC, suggesting any bounce we may get, may offer an opportunity to sell it short or add to shorts.

Yields also drug the S&P lower in red this a.m., but are slightly higher now, suggesting the S&P/Market has some upside room which may offer us a tactical entry on the short side.

Credit Update

Credit continues to deteriorate, although now equities are more closely following credit as they should, which taken with recent (last month or two) readings, suggests very strongly that as 3C depicts, the October rally as well as the volatile lateral topping price action in the market has been uses almost exclusively to sell risk assets (most of that being liquidations of equities, mutual funds and hedge funds by European banks in an effort to raise their cash levels as I have already explained, their leverage ratio is much higher then the United State's-26:1 meaning for every $26 in risk assets they have $1 of capital to cover potential losses, meaning a 4% move against their positions WIPES OUT the banks entire equity and this is why they can not find cash via other banks as is normal, via swap lines, or traditional libor related outlets and have turned to one of the most surreal places for short term funding-the London Stock Exchange-which is another canary in the coal mine, but when this one goes belly up, England will be dragged right in to the core contagion, something they have so far managed to avoid. How British regulators allow this to happen is obscene, but no more so then the way US regulators have handled MF Global's liquidation). In addition to selling risk assets, it would be naive to think at the same  time they were not establishing huge short positions (Trading Desks). The 3rd outflow or distribution in the market is plain old redemptions in which even flagship funds have had to sell assets to cover redemptions (most of which are coming from Europe, but I imagine all financial sector participants are trying desperately t reduce their overall exposure).

Here are my credit indicators, both short term for today and longer term as they are new and you need to be reminded of how far out of whack they still are with equity pricing.

 First commodities which I will cover in another post as they relate to China, they recently have underperformed equities, suggesting that even while the risk off trade over the last 3 days has been in effect, commodities are selling off at a more rapid pace then equities, this morning on a short term basis, equities caught up to the selling in commodities as fears in the equity market are starting to see that pendulum effect I talk about (they swing way too far on the bullish end and then swing way to far on the bearish correction).

 Longer term sine 2009, commodities have led the market, showing a disconnect with equities in Q1/Q2 of 2010 that sent equities lower from their highs, another disconnect at the 2011 area, just before the equities crash in late July / early August and currently another disconnect as the October rally has swung too far with the pendulum effect, so equities still have downside risk just to catch up to commodities in the bigger picture.

 The Euro/Equities relationship that usually has a 1.0 correlation or nearly perfectly in sync, which was not the case while the F_E_D's Quantitative easing was in effect, but the relationship is returning back to normal, the Euro, as I have commented recently, has been much lower then the market and implied arbitrage correlations, today there is a short term move to catch up and reestablish the correlation.

 Slightly longer term, but still intraday, here is the disconnect with the Euro still far below equities, remember the typical correlation is a 1 pip move in the Euro= 2 Dow-30 points. I have to see how far above the correlation the Dow is, but I'm fairly sure it's over 500 points rich.

 Here on a daily chart we can see there's still a large disconnect between equities which are overvalued and the Euro, even the velocity of the recent move down has been much different and I commented on this last week when the Dow was down about 200 points, but the 1 day correlation suggested it should have been down more then 300 points.

 My custom financial's indicator-this is not comparative analysis, but a true indicator, Equities have moved lower to catch up, intraday, financials seem to have a slightly better performance, only slightly.

 Longer term, on a daily hart, the indicator called the July/August melt down is stocks and has a large disconnect again right now.

 High yield,"Equities follow credit" has shown several areas in which equities made for good shorts as they moved up on sugar rush high "news" while credit remained unfazed, in each case equities quickly moved lower, they are now short term in sync with HY credit.

 Credit shows to the left that the market will rise before the market even bottoms, then shows the July top and a current disconnect suggesting more downside catch up for stocks.

 High Yield Corporate bonds and equities move well together and are short term in sync.

 However on a longer term chart, you can see where equities are out of sync with HYC, the higher the red bars, the more out of sync.

 The market tends to revert to the mean of yields and in red we had a major disconnect, the market has since fallen of course and is moving closer to the short term relationship, however on a longer term basis, Quantitative Easing so badly distorted true price discovery as hundreds of billions of F_E_D dollars were pumped in to the stock market, there remains a huge gap between rates and the market. This is the danger of QE that I warned of for the last year, stocks were artificially inflated, not due to true demand, but due to F_E_D money put into the market via the F_E_D's primary dealers through their POMO operations which are now discontinued. The value of stocks is so inflated artificially, that one POMO stopped as IT HAD TO because of inflationary effects, there would be a massive re-valuation of stocks toward their true worth, this is an avalanche waiting to happen and in fact, since July, has been happening.
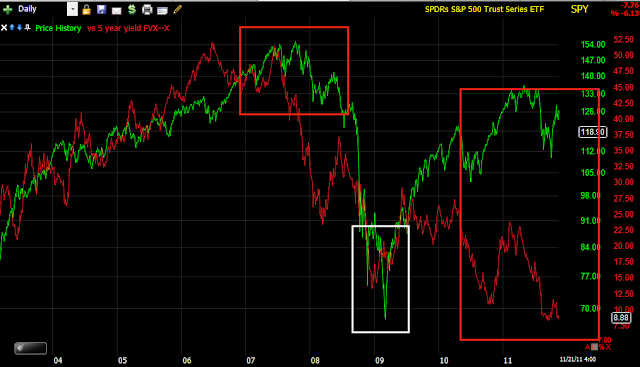
 Here long term rates called the 2007 top and the 2008 fall in the stock market, it also called the 2009 bottom in the market before the market bottomed and now is at such an unbelievable disconnect, it suggests that "if rates remained constant and did not move lower due to market conditions, that the true valuation of the market would be somewhere around or actually below, the 2009 lows, which is what 3C has been showing, a leading negative divergence that is deeper then the 2009 low, in fact the worst I have been able to find over the last nearly 100 years! While our models are singular so we can track the particulars of each asset class and better predict sector rotation such as commodities signaling a problem in China and our models also allow for long term analysis, the CONTEXT Model is basically all of these models combined so you can see where ES is trading vs. where the risk assets (above) suggest it should be trading for the day.

 Here the risk model shows ES (S&P E mini futures contracts) are still trading rich compared to the risk basket and have more to fall to catch up.

Here's the difference in the model showing a growing disconnect between ES and the risk model.


We Are Again on the Right Side of Market Psychology

The recent debate has been the culmination of the October rally top which was a very obvious triangle, you know that I usually come down on the side of a head fake on such obvious price patterns, which according to all of the underlying 3C/credit data, would have suggested an upside breakout as a head fake, however because even that notion had become mainstream, my thoughts were the market in its bid to make the most people wrong at any one time, would do the exact opposite and let the triangle breakdown as it should, one again outsmarting technical traders, who this time thought they would outsmart the market.

 The Triangle breaks with 3 if not 4 solid days of confirmation and the character of the market once again changes for the worse.

 This morning's break is confirmed thus far, however a +2% loss this early will either end the day in a bloodbath or more likely will see signifiant intraday volatility up and down, it's too early and too big of a loss for the market to hold all day, unless it does hold or add to it and then once again, we have another change in character and this time, we are entering the stage 4 decline, the part that comes after the Lehman collapse and at that point, you want to be short and this is why I have not touched a single short position in a month, hopefully we'll get some short term strength to initiate and add to shorts in a better area.


 The Q's gave a hint that the triangle would break down with a false upside breakout.


 3C caught that move and showed it to be false and under distribution.

 The SPY break-volume is nearly perfect for this kind of break, increasing, but not so much as to make the move unstable and oversold.

 The longer term 3C has suggested that this would be the triangle's fate and the long term charts are the most important.

 As for ES, last night I told you it opened nearly 1% down, 3C caught that as well, I said the 3 am EDT opening of Europe would tell us whether the Spanish elections would provide a sugar high or whether the markets are more concerned with bonds, that was answered at the negative 3C divergence on ES at 3 am at the yellow arrow.

And every rally attempt has been met with distribution right up to the open.

I'll be bringing you events that matter and steer us toward understanding instead of volatility of dealing with such a volatile market, we may witness today yet another character change in the market, one which increases the downside catalyst.

Stand by for further updates as I am now loading the credit template.