Sunday, November 27, 2011

Black Friday was a Success, Now for Black December...

If you didn't hear already, Black Friday was a 'smashing" success. I bought a new TV over the weekend and noticed that there were a ton of seemingly nice TVs for sale, all in boxes and not 1 on display. They were name brands and priced very cheap. Then I looked at the reviews, 2 of 5 stars, they were crap, but this is what people were buying.


In Europe, I talked to several people who aren't financially savvy or market savvy and the fear over there is palpable, you could literally see it on their faces (via Skype).  I had a lot of questions like this, "What should we do to protect our assets?"


Well Friday the Greeks threw aside the only thing that seemed to be a sure thing, the 40-50% bond holder haircut, they have bypassed the bank negotiators and are talking directly with the banks and are talking about a haircut that may look more like 25% of the face value or a 75% haircut... The negotiating entity, IIF has been bypassed completely!

This move would have significant side effects, starting with the capital banks in the EU are required to hold, it also makes the EU look like it has lost all control as Greece seems to be handling their own affairs, I guess this is exactly why the new G-Pap wouldn't sign the EU commitment letter, which seemed strange at the time, now we know why.

As you already know Belgium lost their Aaa by one notch from 2 rating's agencies.

There were a lot of rumors this weekend, some addressed here and some new, however one of the more significant is that the IMF may offer Italy between $400-$600 billion Euros at 4-5% Interest, giving Italy up to 16 months to let reforms take effect. The snag is still getting the US Congress to allow it, while the market is excited, in an election year or any other, it will be pretty hard to convince Congress to go along with this one. So we'll have the knee jerk reaction and then the thought out one, which may be a blessing for us.

The fast is becoming self-evident that Italy is the last domino before the EU falls. Austria and France are in danger of losing their Aaa and Germany, well you saw the results of the Bund auction last week, increasingly Italy is the fulcrum, that is if the bond vigilantes don't go after France next.

Remember in 2010 the IMF Board of Governors voted to increase the fund from $357 to $750 billion dollars, but, of the 187 counties that pay the quotas, only 17 have signed on or passed the increase, the biggest donor, the US and many others have yet to take up the issue, so it seems for now to be a nice gesture, but like the EFSF, lacks the logistical firepower.

After last week's market performance, it has become clear to the EU that everything that can be done, must be done (rumors included), even as Ireland runs out of rescue money, German Finance minister SCHAEUBLE says

SCHAEUBLE SAYS HE'S `CONFIDENT' 'EURO CAN BE SAVED
*SCHAEUBLE SAYS EURO WILL BE `THE STABLE WORLD CURRENCY'

Interesting...

Well it seems to have worked as the Euro and ES futures jumped, ES about 1%, however the risk basket in CONTEXT shows this to be an equity only move, we'll have more information when the market opens and we look at out own credit indicators, but this may just be the perfect bounce we have been looking for, all equity and rumor and no substance/no credit risk on.

Since we have had rumors that the Greek Drachma may be re-introduced, there were also rumors of Germany issuing their former Deutsche mark over the weekend as well, if there's any truth to any of this, it seems that it would point to resignation that the Euro and perhaps the EU have actually failed, only the death certificate hasn't been issued yet. Either way, it seems eventually that is the inevitable outcome, however it does remind me of SCHAEUBLE'S earlier statement and how it is probably fairly disingenuous, but after last week, they need whatever they can get to stop the bleeding.

It's ironic that we see the market “appearing” so strong right now when all indications point to this unravelling faster and more disorganized then anyone could predict. Like I said, once you hit the point of no return, markets move very fast, it seems we may have been at the P.O.N.R. For a while now.

Oh, and just for good measure, sanctions have been imposed on Syria by the Arab League, if we follow the Libyan template, a no fly-zone is next. I already commented on the naval (Russian/US) situation from late last week, but now Iran says they will attack NATO member Turkey's missiles if “provoked”.

I thought last week would be volatile and interesting, I think I was a week off.


 FX EUR/USD Sunday night open

 A wider view with the open in black


The ES open with a 3C negative divergence right now, volume is quite low for this kind of a move, it may be just what we were looking for to set up new positions or add to existing, especially if credit remains weak as it has thus far via the CONTEXT model.

 As you can see, ES (the S&P futures) are WAY ahead of the risk basket, indicating that equities are alone on this move, which makes it, thus far, a move with little underlying support from other risk assets such as credit. Of course the 3 a.m. open of Europe could change everything.


Friday, November 25, 2011

That's a Wrap

The market ended the week just like it traded all week, on a VERY ugly note, ES looks to have taken the brunt of the downside.

I will of course have some updates out, but for now, it's time to do some holiday shopping and maybe a little fishing and surfing.


SPY Action

The worst tell today as the 3C ES chart, it's not too busy today, 'm not getting a lot of emails, but I suggested a fade of the market and I know at least 1 member just made some nice Holiday spending money in a few hours!

This was a perfect intraday/day trade short and worked well for at least 1 member that emailed me that she took the trade, is now out and has some Christmas money to spend!

The big news today, as predicted right here last night over the DEXIA problems, the S&P Ratings Agency downgraded Belgium from their much coveted AAa rating by one notch, outlook negative.

Guess who will be next with DEXIA exposure,

Pouvez-vous dire la France?


KCG Trade Idea (short)

As I mentioned, "As the trend starts developing, we'll be moving away from directional trades and in to sector trades with financials being the first target", this is why you are starting to see more individual names rather then directional market trades.

This is a financial and looking bad...
 First on a daily chart, KCG formed a positive divergence in MACD, as well as a bull flag with perfect volume, bit volume on the up days as well as big volume on the lows of the flag which was a reversal doji candle. A top formed and MACD/RSI has been negative throughout, there are two red trendlines of support, 1 broken, the second close.

 On an hourly chart, look at where the volume picked up, as support from a closing as well as gap.

 The 3C hourly chart shows what MACD showed us, accumulation to start the move and then distribution throughout it, this entire move was used to sell KCG shares as distribution started almost immediately.

 A 30 min chart shows more detail with the accumulation in white and distribution in red, note both highs at 1 and 2 were head fake breakouts marking the top and saw a vert fast move down, "From failed moves come fast moves".
The 30 min is leading negative.

 On a 2 min chart, we see the last head fake move in yellow, short term accumulation and distribution in to new high as momentum chasers would have bought a breakout new high as Wall Street went short taking the other side of retail's long trade.

Here's my daily Trend Channel in a solid down trend, if at all possible, I would want to short any strength in the white box, but not above the trend channel. This is a position that I would consider entering in phases, maybe a little now, wait for the next and last support level to be hit, see if there's a bounce and add the rest on that bounce.

Keep this one on your watchlist.

UNG Update-Trade Idea

You may remember the article I posted about Natural Gas and the government (USGS/Army Corp. of Engineers) in a study released right around the time UNG cracked lower, found a connection between the wells that are used to extract Nat. Gas and earthquakes, this must have been a VERY long ongoing study and in my opinion is the sole reason that UNG has been under daily chart leading positive accumulation for some time. I believe the initial knee jerk reaction was "This is not good for Nat Gas" and sent UNG lower, but the larger view is, "This may restrict supply, which would send Nat Gas prices much higher". 3C seems to confirm this line of thought and as I often say, 3C shows us what smart money is doing under the price action, but we rarely know why until later, I think we found out why UNG has been under long term heavy accumulation. Here's an update and my argument for the above theory as well as some key levels in which UNG becomes attractive as a new or Add-To trade.

 The top trendline break is about when the report was released, of course these are routinely leaked. Currently the lower trendline looks like an area that we may want to look at getting long nat gas whether through UNG or another entity.

 On a shorter term intraday chart, I don't think this breaks out today, but this $8-ish level should be watched.

 3 60 min went into a very positive leading divergence as support was broken. One thing I've noticed about long term bases, they almost always head fake/crack lower, right before they start their move up, this is in total contradiction to what Technical Analysis teaches and thus is a very good reason as to why it happens; shares can be accumulated en masse and on the cheap as the weak hands fold.

 The 30 min chart shows the same intensifying leading positive divergence on the recent "U" shaped move lower.

 Here's today's intraday action and why I think it likely will not pop today, besides, the volume and trading day are too thin/short to attract momentum buyers that will flock to the stock once it breaks in to stage 2 markup, which will be represented by a move higher on surging green volume.

 For me, any pullback into the white zone is probably a very low risk buy area, or a break above resistance at this $8-ish level, especially on heavy volume.

 My crossover system on an intraday basis is now moving to a buy signal.

My Trend Channel has flattened out and a move above $8.15 changed the trend by two standard deviations.

Keep UNG on your radar.

GLD Update

While at the moment I remain bearish for now on GLD and question longer term whether a top is building in gold (I have some very unusual ways to judge bubbles which have been successful), this is not the place I would be adding or establishing new shorts on GLD. Here's why...

 GLD is at a support level, you can see at the red arrows this level acted as resistance, once resistance is broken as you can see at the two vertical white arrows and on heavy volume, it becomes support. We have seen 3 days of support at this level which could lead to a bounce or just lateral consolidation, but I don't want to have dead money in the market for any reason and until support is broken, it's dead money at risk.

 Short term there are some relative positive divergences, not very strong, but enough to maintain support for now.

 The 15 min chart is much more bearish and more important to the trend, it shows in white exactly where accumulation occurred, in red where distribution happened and the red box is a leading negative divergence, the worst kind, so the trend remains bearish, it's just the tactical entry that I am concerned with in this post.

Very short term-the last 2 trading days, 3C shows us distribution taking GLD lower and a near perfect signal of accumulation on today's opening lows. There is some distribution in to the early rally, but once again, until support in GLD at $163.00 is broken, my thought is that you have money in a trade that for the time being, isn't doing anything. I DON'T WANT MONEY IN THE MARKET AT RISK UNLESS IT IS DOING SOMETHING OR HAS A HIGH PROBABILITY OF DOING SOMETHING. Our greatest edge over Wall Street is we don't have to always be active in the market (although longer term established GLD shorts I would hold), we can pick and choose out battles and wait for the highest probability entry. I don't believe this is the highest probability as of right now, but soon I imagine.

USO Update/Trade

Remember we were looking for USO to fill the gap created Wednesday and if you listened to my thoughts, (if not already short USO) you would have a partial position. For me, (so long as I can stand the uncertainty of mid-east events over the long weekend), this is a nice looking spot to add another 25% to the short via long SCO/DTO bringing the total planned position to 50%.

 The USO gap is nearly filled today, just off by a little.

 Short term 3C on USO is negative

 Today's intraday is negative (reversal to the downside)

And the 15 min chart is negative.

Something to consider.

And the CONTEXT Model....

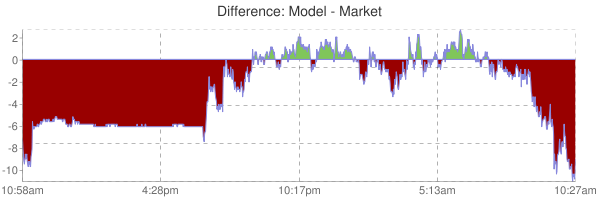
As of 10:27 a.m.


 The risk basket is severely underperforming ES

Here's the difference in the model.


Market Update 2- 3C

Oh my...
 That SNB stick save didn't fool smart money, look at the distribution in the DIA

 Same in the Russell 2000 thus far

 The NASDAQ 100 looks even worse and is now lateral, perfect distribution environment.

 And the S&P.... Distribution on this morning's move up.

 Slightly longer S&P distribution.

However without a doubt, the worst 3C readings are in the E-Minis/ S&P futures.

Look at that leading negative divergence.

Short term traders may want to fade this move up.

Early Risk on- Market Update

The early chatter is the Swiss National Bank is or will adjust the EUR/CHF peg as the Euro was approaching the $1.32 level (side note: the last Goldman Sachs "Buy the Euro" note of 10 days ago was stopped out with their customers taking a substantial loss, I believe their call was buy to $1.40!)

The Euro (EUR/USD) almost breaking the important $1.32 level with a low this morning of $1.3211 and Goldman's stop at $1.34. Of course while Goldman clients lost, the GS trading desk likely took the other side of those trades and made out. As another aside, GS has announced they are giving up on EU calls due to the volatility and unpredictability in the EU. Unpredictability? Everything is going down, why would they issue a long EUR call? That's a rhetorical question.

The Broad risk basket according to my new indicators looks like this, which seems to simply be a legacy arbitrage Euro/FX trade.

 The commodities basket vs the S&P is higher this morning, however it is not higher over the last day as the S&P has broken above the 11/23 highs (white trendline) while the commodity basket is still below the 11/23 highs, so briefly put, commodities are doing what they are supposed to do when the dollar weakness, however ES/S&P 500 is a bit more excited then the typical risk assets that rally with it.

 Here again the correlation between the Euro and the S&P is a bit off, while both are moving in the same direction as they should, the S&P is a bit more excited.

 Part of this may be explained by the Euro losing ground over the US holiday and the S&P just hasn't been marked to the Euro, one easy way to find out is to count how many pips the Euro moved since the 4 p.m. 11/23 close and see what the difference is in Dow points; 1 pip in the EUR should equal 2 Dow-30 points, I suspect that correlation is a bit higher this morning, but I will make the count after this post.

 Early momentum in Financials is clearly leading the S&P on an intraday basis.

 On a longer term basis, and this was also an easy way to identify the top and one of the reasons I told you to short the S&P on that Friday I wasn't feeling well (11/11) , Financials are leading the market much lower. That 11/11 trade as a straight S&P trade even with today's early bump was worth 7.20% and using SPXU as I have been recommending, well over 23%.

 Interestingly, because High Yield isn't correlated to the EUR, it is moving down this a.m., so while equities are risk on, High Yield Credit is leaking lower and as we know, credit leads stocks.

 After Wednesday's sell-off in High Yield Corporates, it is just about in line with the S&P this morning.

 Rates also sold off on Wednesday and the market tends to revert to rates, there's a fairly decent correlation this a.m., but just recently in the red box rates are starting to diverge from equities.

On a long term scale, rates predicted the top as well as 3C both in July and in November and there's still substantial downside before equities revert to rates, assuming rates don't move lower.

I just loaded the SF 3C template and will update that next.