Thursday, January 5, 2012

Update

As the averages either near filling the gap or fill it, here's what's going on...
 The Dow which seemed to start the gap fill move is the furthest away from actually filling it.

 The IWM just filled the gap

And the SPY is close, the Q's have filled it and then some.

 Commodities which were leading the market yesterday are underperforming today, it seems the FCX trade idea was fairly well timed as of now.

 The market is off on its own, unlike previous sessions in which the Euro led the market, today the Euro remains flat. If I have the time, I'll try to count how many Dow points there are in this dislocation from a pretty strong correlation between the two assets.

 Credit remains near the lows of the day and there appears to be no risk appetite there.

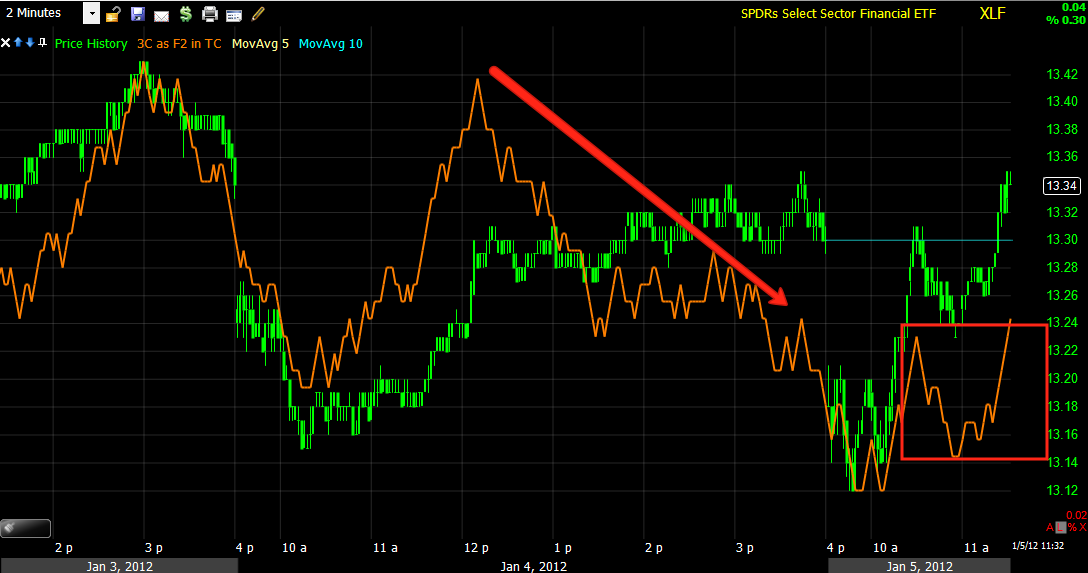
 The XLF/Financials which have been a major market mover today are still refusing to confirm on even the fastest timeframes (1 min above and 2 min below).


Of what I call the 3 pillars of the market, because these 3 groups are usually needed to sustain any move, XLE/Energy is down on the day around -1%. XLF which has been a leader s getting wedgey around a .75% gain and Technology is still red on the day, but near unchanged. It seems XLF is the one to watch moving forward.

IWM, uglier then it first appears

The IWM/Russell 2000 at first glance doesn't look all that bad, but dig down a little deeper and an ugly trend is taking place and to a degree, already been in place.

At first glance, there doesn't appear to be anything of particular note, nothing ominous any way.

 Draw in some trend lines and the bullish ascending triangle, which we talked about a few days ago and I suspected would likely see a head fake breakout that would fail, added the first component, the breakout (at the yellow arrow).

 On an intraday chart, one could argue the most bullish case, there was no follow through on the breakout due to a gap fill yesterday, however with the gap filled now, the IWM is clearly below the triangle's apex ( a position that would suggest the breakout has indeed failed).

 Today on a gap fill on light volume, the IWM also is maintaining the long tradition of kissing the pattern goodbye.

 Today on the 1 min 3C chart, as the IWM tries to close the opening gap on declining volume, 3C has also gone negative.

 The 15 min chart is pretty deeply negative and leading as the recent breakout attempt would have made the highest high on this chart, another seeming false breakout.


The 30 min chart which went positive before the October rally began has also gone deeply leading negative.

Although the SPX is always quoted among traders and the DOW in the media, the Russell 2000 is of critical importance and is the index that the F_E_D quotes and measures the "Wealth Effect".  Because of the number and variety of issues in the R2k, it actually may be the most important average for us to watch and as you can see, looking a little deeper doesn't boost confidence in the average.

Financial's Parabolic move

Earlier I looked at 3C and didn't see anything interesting in Financials/XLF, now there's some development. Remember for 3C to register a signal, we need underlying action to take place and for the best signals, we need a lot of it. There isn't always a trend on Wall Street so there's not always a great signal, but when there is, those are the trades we want to look at seriously.

Any way, here's XLF

 We have 2 parabolic moves in XLF, I don't are which way parabolic moves are, up or down or even benefitting my position, they always cause me doubt as they often reverse in a parabolic fashion. I seriously doubt we are seeing short covering in financials, so I assume there's some set up taking place.
3C is obviously not confirming the move up.

 Here the 2 min chart is in non-confirmation as well. Both timeframes are short enough to move fast enough to confirm.

The bigger picture on the 15 min chart is definitely that of a negative divergence like we saw previously, the effects of the first divergence on the chart are pretty clear.

Market Update

As the Euro continues trading below $1.28 the DIA and DIA only shows a short term intraday positive divergence suggesting it will try to fill the gap and likely take the rest of the market with it. There are no similar positive divergences in the SPY, QQQ or IWM, although ES is in line, something most other averages haven't even managed.


DIA 1 minute positive divergence and the gap area.

Market looks set for another gap filling mission

EIA shows build across all 3

EIA Petroleum Status Report
Released on 1/5/2012 11:00:00 AM For wk12/30, 2011
PriorActual
Crude oil inventories (weekly change)3.9 M barrels2.2 M barrels
Gasoline (weekly change)-0.7 M barrels2.5 M barrels
Distillates (weekly change)1.2 M barrels3.2 M barrels
USO's initial reaction...


We'll let that sink in for a bit and see if any trades come out of this.

This one didn't slip by...

Just within the last hour or so, the biggest news of the New Year regarding Europe's eventual demise just came out.

From Reuters:


Greece EU/IMF aid schedule pushed back three months


Here's the news which s akin to a game of chicken or maybe skydiving without a parachute.

BRUSSELS – Greece’s entire schedule of emergency loans from the European Union and International Monetary Fund is being pushed back by three months because of a delay in the payout of a tranche in 2011, the European Commission said on Thursday.
The next 5-billion euro tranche for Greece that was originally scheduled to be paid in December 2011 is now to be paid out in March 2012, Commission spokesman Olivier Bailly said.
A further 10-billion euros that Greece was originally to receive in March this year, will now be paid only in June and all of those sums can also be delayed if inspectors judge Athens is failing to deliver promised fiscal reforms.
“That cannot be changed,” Bailly said, referring to the three month rhythm in paying out tranches of the first Greek rescue program.

And this is why this is potentially the house of cards coming down...

Greek PM Says Country Faces Risk Of Disorderly Default In March


ATHENS (Dow Jones)--Greece faces the risk of a disorderly default in March if it doesn't complete negotiations for the country's second bailout starting later this month, Prime Minister Lucas Papademos said Wednesday.
In a copy of his comments made in meetings with employer and employee groups, Papademos said the coming weeks and months are "exceptionally crucial" for the country as Greece needs to secure funding from European peers and the International Monetary Fund. Among the financial pressures faced by the heavily indebted government are EUR14.5 billion of bonds expiring in March.
"As a result of our actions and decisions in coming weeks, everything will be decided," he said.
His comments are in line with stark warnings from other government officials stressing the gravity of talks with representatives from the European Commission, International Monetary Fund and European Central Bank on Greece's second bailout worth EUR130 billion.
Details of the deal, which comes after a first EUR110 billion bailout in May 2010, remain unsettled, particularly a provision calling on creditor banks to write down a significant portion of their Greek government bond holdings.


If we put 2+2 together, apparently L. Papademos must have seen this coming, if not then this is bigger trouble then we can imagine. In essence, if Greece doesn't get the bailout tranche soon, they default in March. A 3 month delay=default. Default in Greece= house of cards comes tumbling down.

What in the heck are the EU/IMF doing?


Italy's Unicredit now down 17%

ES Overnight

This should help with perspective.

Last night I showed the ES chart in a negative divergence, it's very reliable.
I marked yesterday's market hours and overnight, you an see the ES negative divergence sent ES leaking lower, at the yellow arrow ES fell apart as the European markets opened, at the white arrow we saw a temporary boost from the ADP/Initial Clams data, and at the blue arrow, the market squarely focussed back on Europe.

Risk Basket

 Commodities are finally breaking down vs the S&P.

 FCX is moving lower, this is what we want to see, I know some of you have already entered a short there.

 Here's FCX vs the Dow Jones Copper Index, as you can see copper is down again today.

 The market's frothiness compared to the Euro is being sorted out today.

 On a longer term basis, the S&P has a wide dislocation from the Euro correlation and plenty of room to fall.

High Yield Corporates are selling off in tandem with the market, remember yesterday credit was warning.