Wednesday, February 22, 2012

RCII Trade Idea

This isn't a very exciting stock, Rent-A-Center, but it looks like a good set up right in this area and the fact that it is not a momentum stock and the momentum crowd isn't in a trade like this, may just have some advantages.

Unfortunately the all of the charts didn't load in the order I wanted, but it's not a big problem.

 First RCII has made a break away gap, these are rare in this market, I really don't think it will be filled, which makes this a more bearish trade based on that alone. Next it has formed a bear flag that volume is confirming and that flag is starting to break down.

 Here's where RCII being a boring stock has some advantages, as you can see on the last bear flag in 2011, there was no head fake move, it's an obvious pattern that would usually be head faked, but if the momentum traders, which are the primary targets of head fake moves, aren't interested in the stock, the chances and the benefit of a head fake move is severely diminished.

 I rarely show Balance of Power because I feel it has little predictive ability, but I decided to show it this time because it confirms the 3C chart and what was going on at various stages.

 Money Stream shows a long term negative relative divergence and at the bear flag, a leading negative divergence. Note that BOP, MS and as you'll see, 3C don't show any positive divergence of any consequence at the bottom when the uptrend started.

 Here's the bear flag, there was a new high posted just before the stock broke down completely (this may have been coincidental as the market was showing similar behavior on the 26th). It is also showing appropriate volume and a negative candle indicating a reversal of the bear flag is likely near.

 Here's my X-over custom screen for crossover signals, there was a long signal when all 3 indicators were green, the yellow areas show price moving averages showing whipsaw or false crossovers as the other 2 indicators didn't confirm, so as you can see, this is a very useful screen if you use any crossover system. The last yellow false crossover though was showing problems emerging in RSI. The sell/sell short signal was clean and confirmed.

 For long term trends RCI needs a 5 day trend channel as it tends to get choppy and then post big moves like the gaps down. This channel holds the long term trends well and just broke the long trend at the white arrow.

 On a shorter basis of 3-4 month trends, the 2 day Trend Channel works well and this is what I would use as a stop, the uptrend has already been broken here as well.

 The long term 3C chart looks very similar to the BOP chart posted above, except 3C quantifies the depth of the negative divergence in a way that BOP cannot. This is extreme distribution.

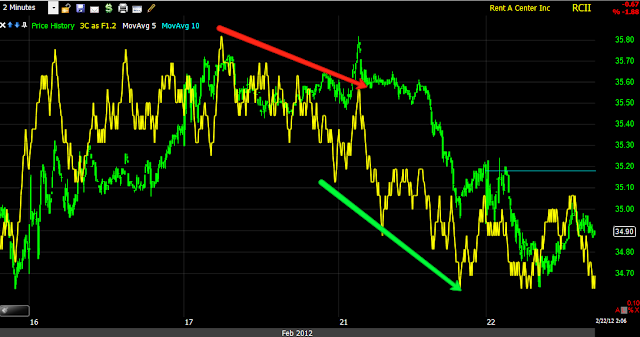
This is the tail end of the bear flag, you can see where 3C went negative on a little price spike and since then price has been moving down, threatening to break the bear flag in the next leg lower, 3C is confirming the downside move.

This is a trade I would consider in this area, it is not a "show me" trade because the majority of the gains come on opening gaps down. I also think the Risk:Reward and probabilities are favorable in this area.

LULU chart request/ Trade Idea-Earnings Trade Ideas

One of our members is pretty familiar with LULU, being a customer and living in the same area where LULU was founded and originally produced their line. I particularly like ideas when you have direct experience with the company or the field they are in. I remember as a Dell customer, I had to return a couple of their computers, around the same time the local outlet they had opened closed and I remember thinking this is a company that I'd like to short if for no other reason then all the time and energy they cost me. A few months later in 2005, Dell fell hard losing nearly 50% over the next year.

When our member was talking about LULU and the fact the stores were empty and the quality of their product (which is high-end sports wear) had deteriorated badly, I kept thinking about the 2011 margin squeeze that continues today, but for a time it was very bad for manufacturers as commodities had run up, so the lower quality makes sense. In any case, they report March 8th so this could be in addition to a regular trade idea, a specific earnings play, but we'll have to check back in on the charts just before earnings. Here's what it looks like as of now.

 This is LLU's relative strength vs their Sub-Industry group, this is not at all the same as Wilder's Relative Strength which compares the stock to itself, this is regular relative strength comparing the performance of LULU vs the sum of their competitors in the same group, clearly it is poor.

 LULU is volatile as you can see by it tracking a 10-dy moving average, it also has a Beta of 2.5 which means on average it will move 2.5x the S&P-500.  There's also a Wilder's Relative Strength divergence at the bottom.


 Here are the local daily sell signals, we have a large one now, also I tried to highlight in yellow the Bollinger Bands narrowing, this is the most extreme pinching of volatility on this chart, which indicates there's a high likelihood for a strong directional move.

 The Trend Channel, which self-adjusts to each stocks volatility and then adds a formula for the channel which is based on 2 standard deviations from the average volatility, so when the channel is broken (at the red trend line), it tells you something significant has changed. The ATR has decreased which is a direct result of the very small candles representing a loss of momentum (the red rectangle shows the area in which the price candle's daily range has become much smaller) and at the bottom, my custom indicator, "Close within the range" has made a new low after trending up, so the daily closes when smart money trades have been weak.

 The hourly 3C chart shows strength in white and distribution at the red arrow, we've seen stocks reverse on a 15 min divergence so a 60 minute divergence is pretty serious.

 There is usually a defining moment that most traders fail to recognize in which the stock's back (trend) is broken, it doesn't mean there will be an immediate decline as Wall Street is still setting up positions, but this area where LULU made a strong move to a new local high and then gave it all back on the same day on a 3C negative divergence looks to be that area in which its back was broken.

 This is that day in yellow...A strong opening and very weak close and on volume, I wouldn't be surprised if longs from that day are still hanging in there trapped.

 Here's the same day on a 15 min chart

 And a 5 min chart, so there's good confirmation.

The two minute chart shows a recent head fake move.

I would prefer to see the trend channel broken before entering a short trade and use the channel as a stop. The other trade that may be worthwhile is the earnings trade, in that case we'll simply need to look at the charts just before earnings and if they are like they are now or worse, it's likely there's been a leak and LULU is being set up now for the move to come after earnings.

Context

For the second day, the market has under performed the implied FX correlation...
 However, we saw the same thing on the way up, except the market ignored the correlation, I am not in the crowd that thinks the correlation is broken, I believe it will revert to the mean. That means the longer term implications have to be considered, the market intraday is below the Euro, but way overvalued vs the FX arbitrage and therefore is actually still outperforming the Euro even as it falls.

Take a look at the long term chart below and how far the market has on the downside before reverting to the mean... We also have to consider, just as it overshot on the way up, it is equally or even more likely it will overshoot on the way down.


Below, it's the exact same situation with commodities, the market is underperforming them for a second day.


However, longer term, the market has a lot of downside before reverting to the mean of these two risk assets that typically move together.

Here I compare commodities with the Euro/USD and you can see they are following the pair's cue.

Sector rotation...
Financials, Energy, Discretionary and Basic Materials are rotating out, Technology (the strength in the Q's) is still maintaining, but not in strong rotation. The defensive groups are rotating in (we saw these groups cresting yesterday so it's no surprise they look as they do today-once again it is the small things that matter); Utilities, Healthcare, Staples and Industrials (most likely a flight to quality) are rotating in, although Industrials could crack.

Update

 The DIA 5 min chart, right now we can't call this much more then a technical shakeout looking at this objectively, but as I have used the phrase "Picking up lose change in front of a steam roller", it will be very difficult to differentiate moves that look like a simple shakeout like this and the big one that just doesn't comeback. The underlying action has made the market like an ever thinning ledge, in other words, the environment for that day that just doesn't come back is there so it's not like we can look to that for a clue, it's been bad for a while.

 DIA 1 min is in line with price

 As is the 2 min

 The 5 min will take a little longer to catch up to a move that was that fast.

 The IWM 5 min chart has also broken below support

 The 1 min 3C chart is in perfect confirmation

 As is the 2 min, but there's still potential for a relative positive divergence to form at this exact stage.

 The Q's holding above support is really the market's saving grace at this moment. Dow Theory does matter, whether it's long term like I illustrated earlier or short term.

 QQQ 1 min is in line, confirming the price trend.

 So is the 2 min.

 SPY 5 min

 Surprisingly the SPY 1 min chart is a bit stronger then the price action, but...

The longer 5 min chart is more negative.

The IWM is at a loss of .84%, in the last several months, the market has not been able to hold losses this big (as moves have been relatively small) this early in the day. If the market can hold this loss and add to it, we have a definitive change in character and the downside risk becomes much more grave, but you know what I've been expecting, all the pieces are in place, it's just a matter of time. However until then, we have to assume that the market will continue the trend of not letting big early losses stand until the trend ends and we will have a key piece of the timing puzzle when that happens.

Averages Breaking Support

The Dow, SPX, and IWM have just broken support represented by the range from late yesterday and early today, the QQQ has not broken down yet, I would keep an eye on the Q's for a break and volume here. The Q's not breaking could lend the market some support.

 DIA

QQQ

GLD Update

This is a follow up from yesterday's GLD update as there' a potential trade here, make sure to see yesterday's post if you are interested in a potential GLD trade.

 This is a long term chart of TSV (TSV 55), TSV is a money flow/divergence indicator like 3C, but is usually used in shorter time periods like 10, 18, 28 and 38; I prefer to use time periods that few others look at and that reduce noise to uncover the trend. TSV did a decent job identifying the top in retrospect, I think 3C did a much better job in clearly identifying the top. TSV did do a good job identifying the bottom in December, which as I mentioned yesterday would have been around the same time Paulson would have been dumping GLD (one of his top 5 positions and the only of the 5 that was profitable on the year) to meet redemptions in January, I do think the GLD bounce had something to do with redemptions as hedge funds sold the physical and ETF to meet redemptions as they had a horrible year and there was already a trend of money flowing out of the market regardless of fund performance. This would have left a lot of gold/GLD supply at low prices and easily accumulated. The current break above the channel is just at zero in TSV which would be neutral, but would be taken negative as it did not show accumulation on the move up or at the break above the channel.

 Short term 3C this morning is slightly negative, the break above the channel shows a much clearer negative divergence.

 It may be early for any good readings from the 5 min chart, but not much has changed there. We are looking for signs that GLD is either being accumulated and therefore a potential long or as we have seen thus far, shows continued distribution which would give us a low risk head fake short entry. This could happen today or in a days, but it's close to tipping its hand one way or the other.

 The Australian Dollar which has the highest correlation to gold and as I demonstrated in yesterday's post, has been a leading forecasting indicator for gold's direction, continues to show a negative divergence on the 15 min chart and has moved lower today thus far.

Since FXA (Australian Dollar) is a leading indication for gold, I decided to take a closer look at FXA (its ETF) to see if there were any clues as to where it is going, essentially getting a head start on even the FXA signal.

 As you can see, FXA broke down below support and is rounding over, for reason I will show you, I don't think this is a consolidation, but rather a reversal.

 Using the Trend Channel which has held the entire move up since mid-December, there was a stop out  about 8 days ago, the channel has turned lateral and looks to be turning down now. If this were a swing trade, FXA would already be a short.

 This hourly 3C chart of FXA is why I believe this is a reversal and not a consolidation, I pointed out the relative negative divergence, but the leading negative divergence is quite clear and this is a long and important timeframe so the distribution signal here is VERY strong.

 The 15 min chart's signal is even stronger because we see underlying moves on shorter timeframes first as they bleed in to the longer term charts if they are strong enough.

Intraday, there's a relative positive divergence in FXA, but only on a 1 min chart, this could be a consolidation or perhaps an intraday bounce, but thus far it is contained to a 1 min chart and thus not very strong.

After looking at these charts, I would say the probability of yesterday's move in GLD being a head fake/shakeout move, has increased.

Dow Theory Divergence Worsens

Another sign that this bull market rally is more likely to be a bull market trap is in the continuing and worsening divergence between transports and the averages. We don't have to get in to the nuts and bolts of Dow Theory, but if the economy is expanding then transports should do well, even if there are expectations for the economy to do better, transports should do well, they deliver the goods that many of your favorite stocks supply.

Here's a look at transports...
 This is the IYT Dow Jones Transport Index Fund vs the Dow-20 Transports, they look virtually identical. Yesterday the IYT (and probably the DJ-20 as well) made 25 day new lows or over 5 trading weeks and on impressive volume.

 Here are transports in green vs. the Dow-30 in white, that's a Dow Theory Divergence or red warning flag.

Even more interesting is the typical leader of risk on rallies, the Russell 2000, is starting to look more like the transports then it is the other averages, another red flag.

As a matter of fact, lets look at the IWM vs the SPY
 The SPY is green, the IWM white. If volume alone doesn't send up a red flag, then the underperformance of the IWM certainly should.

Here's a closer look...

Don't be fooled in to thinking, "This time it's different" when you see the Transports and IWM divergence and certainly not when you look at volume. I've seen many rallies collapse as traders ignored volume which is the second most important indicator you can put on a chart, unfortunately, traders have become lost in a sea of the latest fashionable indicators in their search for the Holy Grail (most traders using Technical Analysis do so out of pure laziness). There is no 1 Holy Grail, the market is a jigsaw puzzle and you have to look everywhere for clues and hints.

Overnight

It's still mostly about Greece, mostly...

So lets start with China.

Shanghai eased real estate restrictions making it easier for a "Broader pool" of buyers to buy a second property in Shanghai. The definition of ""Broader Pool" seems to be a matter of locals vs non locals, with locals being either born in the city, having worked there an extended amount of time and officially recognized as locals. The new guidelines say residence permit holders who have lived there at least 3 years are able to buy a second home. It's a small step, but expected to boost sales by 20-30% and another indication of the property bubble that is spiraling out of control. I wouldn't be surprised to see inflation pick up substantially as the PBoC tries to deal with the housing crisis and crisis it is if you saw last night's video.

After 4 months of housing declines, China's January Home Price Index fell to a new 1 year low, not 1 city in 70 monitored posted even a slight gain.

China's Flash Manufacturing PMI came in at levels of contraction at 49.7.

Now on to the EU... 

The hope that the recession in Greece would be short lived was dashed today with Euro-Area PMI composite coming in below consensus of 50.5 which would be a slight move out of contraction, instead it printed at 49.7 and still in contraction. The Manufacturing PMI was 49 on consensus of 49.4, Services came in at a disappointing 49.4 on consensus of 50.6. The total Euro-Group PMI may influence the votes that still need to be taken by individual counties to approve the Greek bailout and they may not be as at ease with supporting the bailout as they see the probability of recession when Q1 2012 numbers are released.

There is talk among ECB insiders that they are hoping the next ECB LTRO (Long Term Repo Operation in which they take collateral rated at A and it seems this time they will take collateral below A and give the bans a 3 year 1 % loan) take up will be far below expectations. There's a feeling that the banks are leaning on the ECB too much, of course this could also be an internal debate about ECB balance sheet expansion. In any case, with sentiment running the way it is inside the ECB, the market may get a surprise in hearing that the next LTRO may be the final LTRO which will not be welcome news.

As for the Greek Debt Swap, the terms started looking a lot worse for creditors when the secret Greek Debt Sustainability report came out finding that Greece really needs $245 bn rather then $130 bn to get even close to the 120% of GDP target by 2020. This increases the chance that Greece will not only pass the retroactive CAC clauses, but use them with a threshold of 66% to force creditors to accept losses, which is another can of worms as lawsuits will be flying among for numerous reasons and a default as described by all 3 rating agencies, will occur, likely triggering CDS and putting intense pressure on the Euro banking system as a whole as they have been writing the insurance contracts, not expecting them to ever have been triggered.

In a sign of sentiment, the Greek GGB's have hit a new high yield, last week was a new high at 638%, as of this morning, it is 763%!  Remember yields move opposite to bond prices.

Another signal that investors are starting to understand the implications of the Greek Debt Bailout announced yesterday, the Greek Banking Sector index rose from Monday on the news Greece had been saved and promptly dropped, any buyers on the news Monday are now at a 24% loss.

In one of the most bizarre bits of news out of Greece and right in time for today's planned demonstrations (riots):

"Salary cutbacks (called "unified payroll") for contract workers at the public sector set to be finalized today. Cuts to be valid retroactively since november 2011. Expected result: Up to 64.000 people will work without salary this month, or even be asked to return money. Amongst them 21.000 teachers, 13.000 municipal employees and 30.000 civil servants."

Yes, you read that correctly, Greece is really taking this retroactive thing to heart, Public Sector workers will work for free this month or even be asked to return money in addition to working for free. Cue the fires.

Today is rather light on US data because of the holiday, we have a slew on tap for tomorrow.