Thursday, March 8, 2012

PSI to be announced 1 a.m. EDT

Greek PSI should be out any minute

 EUR / USD volatility ..

I expect the initial reaction will be seen here in the EUR/USD first...

AAPL only 3 points away

 AAPL Intraday...

 AAPL only 3 points away from making that new closing high I've been hoping for all week.

Here's the underlying support for AAPL, which essentially there is none.

A new closing high going in to a disappointing NFP tomorrow would be a prime set up.

Market Update

As a reminder, he Greek PSI results are do out in 20 minutes. It sounds like either way they go, there are a lot of open issues. There's a lot of potential for knee-jerk volatility...

That last ES divergence looked like it was going to be trouble.

 DIA 1 min

 DIA 2 min which has been leading negative all day deteriorated...

 IWM 1 min

 IWM 2 min is the same situation as DIA 2 min above.

 QQQ 1 min seems to have one of the sharpest negative divergences.

 The 2 min remains in leading negative territory.

 SPY 1 min went leading negative very fast.

Even though it has been in a leading negative position all day, the same move can be seen on the 2 min.

AAPL just saw a break of the intraday trend on the highest volume of the day.

Reality of Today's Rally

As mentioned early today, ES moved up with the EUR/USD, an event I was looking for yesterday, it happened today. The catalyst, there was none, which is also what I was looking for (more specifically a floated rumor to lift ES overnight that was bunk).

The main attraction in economic data today was Initial Claims,

Released On 3/8/2012 8:30:00 AM For wk3/3, 2012
PriorConsensusConsensus RangeActual
New Claims - Level351 K351 K345 K to 360 K362 K
4-week Moving Average - Level354.00 K355.00 K
New Claims - Change-2 K8 K


They missed and this going in to tomorrow's NFP, not exactly a risk on friendly environment.

A just released Gallup poll found that February jumped the most since 2010 for the 3rd consecutive monthly increase, this in front of tomorrow's Non-Farm Payrolls.

Again, not a market risk friendly piece of news.

The point of what I'm getting at can all be summed up by Soc. Gen's comments on today's market action...


"I have tried my best to remain relatively bullish towards global emerging markets (GEM) over the recent period despite the global risks, but even by my bullish bias standards, today’s move is simply stupid. EM assets are rallying with a vengeance today, but the timing of that move is just wrong, in my view. Why now, ahead of a massive event risk, namely the results of the PSI released tonight?

It is still unclear whether the outcome for the PSI is going to be a market-friendly one, and in any case, it is not going to be a straight-forward one to interpret for global investors either given the rather complicated structure of the deal. We basically have some serious disappointment doubled with some uncertainty. So unless EM investors know something I don’t—which would indeed make me stupid—today’s move is at best premature and quite a bit far-fetched.

I am happy to participate in this EM rally on Monday morning, once we have got confirmation that the PSI outcome was favourable and that the NFP was risk supportive."

So in effect, there's huge event risk, economic reports that are not favorable for tomorrow's NFP and huge uncertainty surrounding any Greek PSI outcome, yet the market rallies...

Looking at the earlier Market Update showing negative and leading negative divergences, this move DOES make sense to me. If you recall what I am looking for in the market to signal a solid reversal (and recall last night's breadth post that left me breathless), the rally is necessary, a head fake move even more so. So this apparent, "Stupid move" actually does make perfect sense if you read Sunday's analysis of what I was looking for this week to signal the end of the market's move up and a much nastier move down.


ES Update

As most of the averages have stalled since 1 p.m., ES is really starting to look bad...


Market Update

This update is a little more detailed and a little more complicated then usual, but we are at an important crossroads so I'll do my best to make it clear.

 DIA 1 min is the closest to in line out of all the averages and timeframes, there was a negative divergence on the open sending DIA lower this morning and then a positive divergence (remember the 1 min is pretty much intraday moves) sending DIA higher, right now it i in a relative negative diverence here.

 The 2 min chart is still intraday moves, but more influential. You can see where we saw the positive divergence on the expected bounce and yesterday's strange negative divergence around 12-1 p.m. in all of the averages, it created a leading negative environment for the DI which it remains in with a small negative divergence now (or at the time of capture 10 mins ago or so).

 The 5 min chart is more influential and excellent for this kind of bounce we were expecting (as of last Friday and Sunday's analysis). The positive divergence is clear, however yesterday's odd negative divergence again around the 12-1 p.m. timeframe is also clear. This chart is actually leading negative as we have higher prices today, but 3C hasn't made a higher high and remains below yesterday's highs.

 A closer zoomed in view of the DIA 5 min shows a negative divergence on the open sending the DIA lower and a very small positive divergence (white) at the a.m. lows. Right now, We have several negative divergences, not only the larger leading negative seen above, but also a smaller one recently.

The bottom line is that there are negative divergences in to the bounce, which is what I want to see.

This is the ES chart below (E-mini S&P Futures)
At the pre-market highs reached in ES overnight, there was a quite large negative divergence, it is actually leading negative. We saw a positive divergence at the a.m. lows after ES declined more then 8 points from the negative divergence at the pre-market highs, that's a big fall in ES for a short period of time. The bounce of the morning positive divergence is now going leading negative.

 IWM 1 min showing the positive divergence to the left that started the bounce, again the unusual negative divergence yesterday around 1 p.m.  which has kept the IEM in a leading negative position as prices are higher this morning then yesterday, but 3C is still below yesterday's high.

 This is a close up zoomed vie of the IWM 1 min chart, you can see a negative divergence on the open sending the IWM lower, there was NO positive divergence at the a.m. lows today, so the IWM seems to just be floating with the market. The green arrows indicate an in line move (however remember this is within a larger leading negative divergence), this is where it is difficult to understand, but just remember the 1 min chart is intraday moves. As of the capture, there was a slight leading negative divergence building, this can represent a consolidation or a pullback.

 IWM 2 min shows the bounce as all the charts do and yesterday's strange 1 p.m. negative divergence. Note the IWM is in leading negative position with a divergence at the highs of today.

 A closer look at the IWM 2 min chart shows yesterday's strange negative divergence and the leading negative position the IWM remains in, again at the bottom this a.m., there was NO positive divergence.

 IWM 5 min with the positive divergence for the bounce at the left, the negative at 1 pm area and a continued leading negative posture with a negative divergence on the open today, still no positive divergence today at the lows.

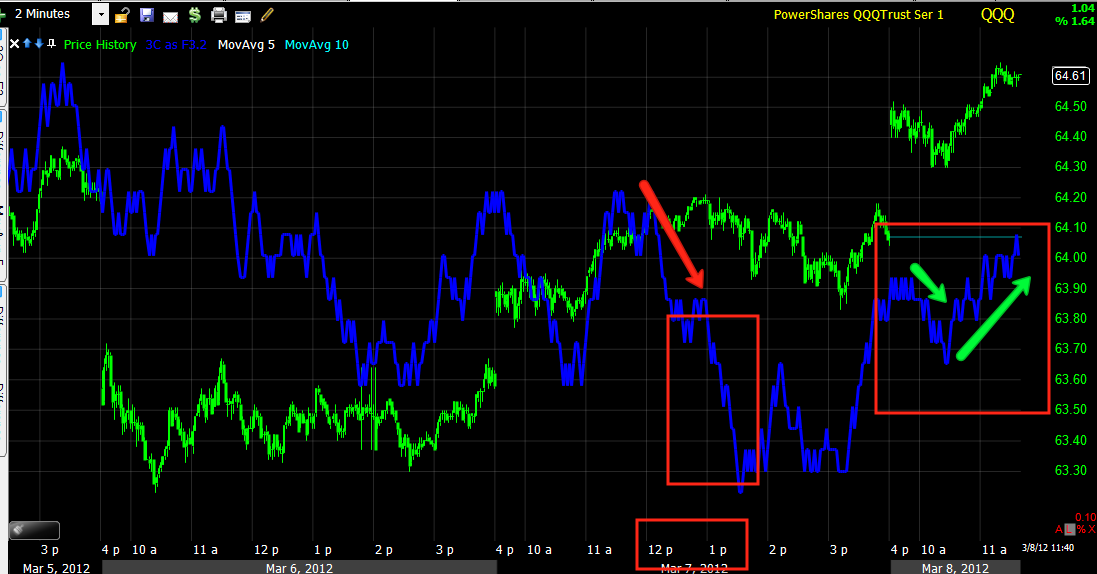
 QQQ 1 min showing the divergences for the bounce up, yesterday's 1 p.m. -ish negative and a stronger negative divergence currently

 The 2 min chart has remained leading negative, even since the bounce started.

 A closer look at the QQQ 2 min

 QQQ 5 min shows the strongest negative leading divergences at yesterday's 1 p.m. area and continuing in to today as 3C refuses to make a higher high.

 A bigger picture of the 15 min QQQ chart, since the top, the Q's have remained leading negative, showing no real positive underlying action at all in the bounce, which is what I expected to see and wanted to see.

 SPY 1 min with the same positive divergence to the left that started the bounce, the same strange 1 p.m. negative yesterday, a negative on the open sending it lower and a positive at the lows sending it higher, there' a slight negative in place.

 Today's action on the 1 min, shows the opening negative, the positive at the lows and the strat of a leading negative.

 The 2 min chart is interesting, since the positive divergence starting the bounce, the leading negative divergence ha just grown, really starting at 1 pm yesterday.

 A closer view of the 2 min, SPY remains in a negative divergence, both relative intraday and leading on a longer term basis as seen above.

 SPY 5 min I think is pretty clear.

 We have had some gap filling, but for a real head fake move, there would need to be a close above the red trendline in any of the averages , this is the SPY.

 The QQQ may be the best candidate for such a move...

 The DIA

 The IWM, I don't think this has much of a chance.

 And here's what it would take on a closing basis in AAPL

As mentioned yesterday, we did see a head fake move Monday a.m. that sent AAPL lower, but I'm starting to wonder if the action since the 15th in the yellow box has indeed been the head fake move in AAPL, a break below the red trendline on volume would confirm this.

In any case, all of the averages are showing very weak underlying 3C readings in to the advance and the market is starting to look more like a small bear flag, meaning perhaps we have already seen the break. The 3C trade shows the weakness in the move since the bounce started.

I'm going to take a look at some other indications and post them.


AAPL-Remember the 15th?

 This is the 15th on a daily chart, way out of character for AAPL's trend.


Here's the 30 min 3C chart, since the 15th, I have said, I believe this was a major event and we will look back upon it and see it was so. This may have been the day, the back of the current trend in AAPL was broken. 3C has been in a leading negative divergence since the 15th.

Could this be why? We know we are way behind the information curve, but could Wall Street have been aware of this problem summed up by the WSJ?


U.S. Warns Apple, Publishers

Justice Department Threatens Lawsuits, Alleging Collusion Over E-Book Pricing


The Justice Department has warned Apple Inc. and five of the biggest U.S. publishers that it plans to sue them for allegedly colluding to raise the price of electronic books, according to people familiar with the matter.

HGSI Partial Profits

Since yesterday's calls were opened at $.22 I have a nearly 40% profit in HGSI in the Model Portfolio, I'll be taking partial profits here.


I'll keep about half the position open for now....


ES Overnight

On Tuesday I expected a move higher in ES led by Europe, the Euro wasn't so co-operative yesterday, overnight, this looks a lot more like what I expected, it has even lifted AAPL thus far.

 ES overnight...

 The Euro supporting it

Even AAPL is up in pre-market

And the news that lifted it? A Brazilian rate cut deeper then expected? The BOE and ECB leaving rates unchanged? Bad news for the Japanese economy? No, just because, also as expected (actually I thought they may float some rumor-maybe the sterilized QE from yesterday, although that would have no  effect on the stock market being sterilized).

So maybe we can still get that head fake move, I haven't seen too many major reversals that didn't have one first.

I have an appointment with my back Dr. and will be back at 10 a.m.

See you then