Monday, April 23, 2012

Curiosity About Tech-XLK, PCLN, AAPL

Being BIDU looks the way it does as well as the QQQ update, I thought I'd check the other two tech stocks that were showing positive divergences late Friday, AAPL and PCLN-as well as XLK (Tech Sector).

 AAPL's 60 min chart (posted last night) has shown how much underlying damage has been done in AAPL, even while AAPL looks relatively flat, this is where we almost always see the strongest divergences, in to a relatively flat area, although AAPL is clearly rounding over. Take a look at the parabolic move of 2012 in AAPL on a 5 min chart and you can see the "what goes up must come down" concept of parabolic moves is taking place in AAPL. Today AAPL broke another support level, but I still see no reason why volatility won't continue to increase, making for some potential big swings. I'll be looking to start an AAPL equity short (tried that last week but put in a fat linger long instead).

 As suspected, AAPL 1 min showing strong 3C leading positive momentum. Late Friday in the model portfolio after the AAPL, PCLN, BIDU post, I did manage to squeeze in an AAPL May $570 call in the options model portfolio.


 AAPL 2 min is seeing the strength bleed through.

 a new 3 min chart is showing the same.

 AAPL's 5 min chart is seeing one of the stronger positive divergences it has seen in the last few weeks.
I'm not sure what the play is here, earnings? The F_O_M_C? Or just plain old volatility?

 PCLN also broke the area I considered to be a top formation, although not large, PCLN is also a parabolic mover, look at a 5 day chart and you'll see the parabolic move failing, a large top would not work for the parabolic failure. I'll be looking to start an equity short in PCLN which should have already been started by now, but placing trades in the model portfolio is the last priority for me in a fast moving market.

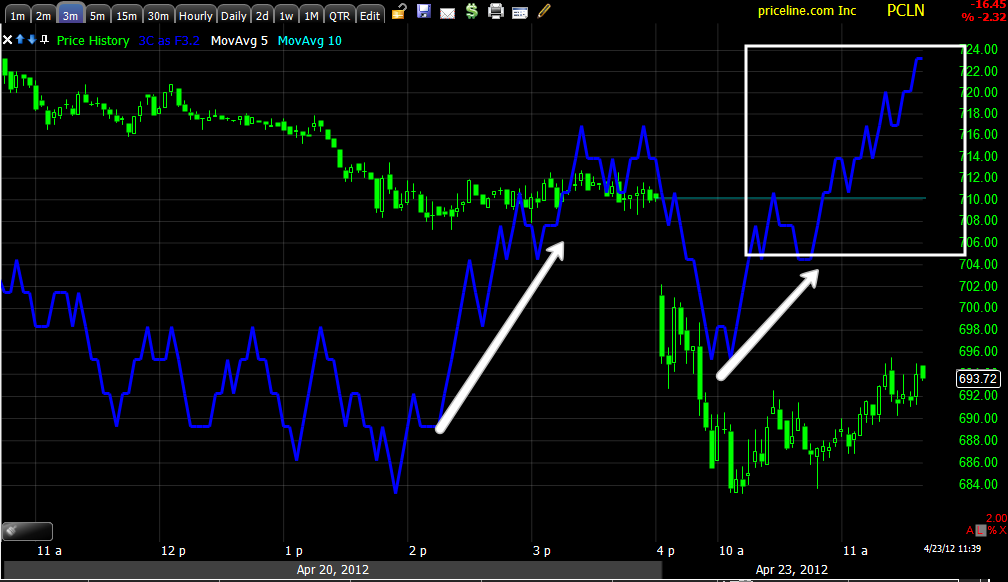
 PCLN 1 min is continuing to put in a positive divergence, it does appear that whatever Friday's late day plan was for Tech, is not being abandoned quite yet, although I suspect adjustments will have to be made because of today's open, this could lead to a very volatile 1-2 day move, still when looking at the bigger picture, almost anywhere in this area seem like a decent place to start building a position, the 5 day chart should show you how much potential downside there is even from here.

 PCLN 2 min

 PCLN 3 min

 a relative positive divergence on the 5 min

 Tech has broke its rounding top, be sure to see RSI 6 at the bottom of all these daily charts.

 XLK 2 min leading positive

 XLK 5 min leading positive

 XLK 15 min relative positive.

This market does not seem to be done with volatility moves. I continue to view these moves as opportunities with options on very short trades, but they are getting more and more speculative and dangerous. This is why I'm trying to cautiously transition to straight equity shorts so I don't have to worry about strikes and time decay.

BIDU Follow Up

 This is the BIDU head fake move out of what is almost certainly a large triangle top. I've been using leveraged positions to play the volatility and chop nimbly in the model portfolios, but as I made clear the last 2 weeks, I want to move away from those type of positions and more in to pure equity shorts. I had already established a short position in BIDU stock (not options) and will loo to add to that position now that this head fake area is breaking down, as usual though, a mortally wounded animal is at is most dangerous and being it is a May put (the expiration is not long enough for a longer term position that I'm looking for in BIDU) and with that profit and the charts below, it was time to take it.

Look at the leading positive 1 min chart in BIDU, even if this is just a gap fill attempt, there's no reason to let that profit slide as time decay starts to become an issue.

The 1 min chart strength is bleeding over to the 2 min chart.

I'll be looking to add to the established BIDU short position in the model equities portfolio.

Taking Profits and Closing BIDU May Put


With a nearly 63% gain in the May $150 put, it's time for me to sell this one. I'll follow up on BIDU in the next post.

GDX/GDXJ-Gold Miners

I covered GDX Friday and the possibility it was setting up a volatility bounce , one of the things I was looking for was the bearish triangle to break down below GDX $46, that has clearly happened, that was to be the head fake trigger event. To be clear, if you have not read Friday's analysis, you should, I AM NOT bullish on GDX, but do see a potential quick long trade, which I would consider speculative. I would be looking to use calls for a short trade of 1-3 days maybe.

 This 5 day chart of GDX is why I can't be bullish on GDX for anything more than a volatility shakeout, but that still may be a worthwhile trade.

 Here is the break of $46 described in Friday's post linked above, this is what I was looking for to happen to set a bear trap, all we need is some positive divergences confirming the bear trap.

 GDX 1 min is showing a very recent and so far fairly strong 1 mi positive divergence, I would like to see a pullback in GDX intraday with the divergence strengthening before starting a Call position there.

The stronger trade may be the Junior gold miners, GDXJ, the divergence here is much sharper.

I'll continue to update the possible entry, a 'V" reversal is not often seen so I'm hoping we get a pullback with confirmation the divergence is expanding.

Market Update

I hope you have been phasing in to short positions on price strength since April 10th, I have set up several equity short positions, if you haven't as mentioned last night, the volatility should remain high, this is early Monday, we have a lot ahead of us, especially tomorrow and Wednesday. With the way the long term charts have been breaking down, as I have warned, we are closer and closer to a break of the ledge that is unrecoverable. Is this it? It feels like it, but as I mentioned, it's early Monday.

If you had a chance to skim through the news events mostly out of Europe, you'll see why the global markets are red today.

 Here is the relative quiet of Sunday's FX market open in the EUR/USD in green, you can see where EU data started coming out. No hour or 30 min 2 min divergences from Friday afternoon would stand a chance against that kind of Euro weakness and dollar strength. There are some reports that China is trying to maintain a bid under Euro $1.30 to support the currency so Chinese exports don't become too expensive.

 Interestingly in ES, there's a very sharp negative divergence, leading, just before Europe opened, since price didn't immediately follow, I would dare to say that there were leaks, just what was leaked, who knows, there's so much from government breakdowns to economic reports, but there was a clear, very strong bout of selling BEFORE ES broke down closer to the European open.

 The DIA Friday 2 min pos. divergence and what I mentioned in the last post as some signs of stability in the market materializing, it's hard to say if the Friday divergence will be taken as a loss or whether a larger divergence including Friday's will be carved out. In the latter situation, they would need one heck of a volatile day up to recover Friday's short bout of positive divergences. There's another scenario I have thought about this morning, since the SPY close on Friday was so specifically targeted to take out the massive increase in Calls from $138-$140, they may have supported the market a little as the seven cent close below $138 would make many of the Puts at $138 in a near useless position, although they would have made the strike, when considering premiums and transaction costs, the $.07 probably would not be worth it, essentially making the $138 puts virtually useless unless exercised.

 IWM 1 min showing some stability i the market forming this a.m.

 Strangely the Q's which where the strongest looking late Friday continue to build on that strength.

The SPY Friday divergence of about an hour and only on a 2 min chart was clearly run over this morning, the question is whether this is a real change in character (essentially the 'Every person for themselves" hedge fund mentality I've been talking about which makes this market very unpredictable) or whether they will try to build one more volatility attempt. It's pretty early for the market to hold these kinds of losses without intraday movement and retracements, the HFTs need that action to make money.

And to think, this week is just getting started, interesting week indeed.


Europe's Perfect Storm

I meant to mention in last night's post, "Quiet markets always make me nervous" as something big usually pops up, sort of like a Bollinger Band Squeeze.

I'm not in the habit of copy and pasting, but there's simply too much data and it will take too long to write it all out, so here's what happened in the EU overnight... I will bold the very important parts that you should take note of.


First we got French and German PMIs which were nothing short of abysmal: the France Services PMI fell to 46.4, or in fresh contraction territory from March's 50.1, a 6-month low, even as the Manufacturing PMI remained virtually unchanged at 47.3 compared to 46.7 in March. All this of course adds insult to last night's Hollade victory injury for capital markets which certainly are not happy with the forthcoming change. But if France was ugly, Germany was downright abysmal with the composite PMI back down to 50.9 from 51.6 in March, dragged down by the Manufacturing PMI which hit a 33-month low of 46.3 (from 48.4 in March)! But, but, the Ifo and Zew... The end result- Eurozone April Manufacturing PMI slumped to 46 vs 48.1 Est. while the Services PMI dropped to 47.9 vs 49.3 est, with the Employment Index sliding to 48.3 fro 49.2 in Marc - the lowest since Feb 2010. In short, the quadruple dip didn't take long. But wait there's more: the Italian Consumer Confidence number printed at 89 the lowest since the series began in 1996, falling to 89.0 from a revised 96.3. Did we say falling, we meant imploding. But wait there's more. The Bank of Spain just announced that Spanish GDP fell 0.4% in Q1, confirming that the country has entered into a recession. But wait there's more. Eurostat just reported that Euro Zone govt debt-to-GDP ratio rose to a record 87.2% in 2011 from 2010's 85.3% revised from 85.4%; there was a silver lining - the deficit narrowed to 4.1% of GDP v 6.2%, yet exchanging record debt for a modest drop in deficits is hardly equitable. But wait there's more. As of minutes ago, the Dutch Cabinet and PM has formally offered its resignation to the queen, on the backdrop of this weekend's stunning news, which in turn means that the country's AAA rating is about to be slashed as first Citi and then the rating agencies warned, confirming that the contagion has spread not only to Spain and Italy (whose banks are about to be serially halted) but the core once again.
Yet while a lot of the above is noise, the big issue is that the European growth dynamo, Germany, has now definitively stalled.


Our equity Bloomberg screens are bright red, as equity markets sell off across the globe. Several reasons are contributing to the market selloff: 1) several firms in Asia posted weaker-than-expected earnings, 2) worries that Europe's debt crisis still threatens global growth, 3) the French elections, and 4) a breakdown of budget talks in the Netherlands.

After seven weeks of negotiations, the Dutch government failed to reach an agreement on budget savings of €10-15bn. That is needed to reduce the budget deficit from 4.6% in 2011 to the maximum 3% deficit rule for Europe by the end of 2013. Failure to reach agreement on reining in the budget deficit would be marginally pro-growth; however, it raises the risk that the country loses its AAA credit rating.

The HSBC flash manufacturing PMI for China remained in contractionary territory, at 49.1, in April. In March, the index stood at 48.3, indicating that the pace of contraction was slowing. Markets tend to focus less on the HSBC flash PMI report and give more weight to the official release issued later, on the first of every month. The official measure remains firmly in expansion territory, at 53.1.

Russian Main Sector Trading Halted


Market Update

I've been watching the market this morning in amazement, overnight the perfect storm gathered in Europe, more on that in a subsequent post.

For the moment it looks like some signs of stability are forming in the major averages. We'll see shortly if they can hold up across a global sea of red

A Quiet Open

Sunday night the FX and futures market opened quiet, but judging from late Friday's activity and the week ahead, I'd say this is the calm before a very interesting week.

Here's what the open in ES and  EUR/USD looked like Sunday night...

 S&P E mini futures opened slightly down from Friday's close and remain rather quiet thus far, however there is a 1 min positive divergence in ES which makes sense with the late Friday action I mentioned (not surprisingly the underlying action intensified during the last 30 minutes of trade when institutional money is most active in the market).

The Euro opened slightly down as well, thus far it remains subdued.

We do have an interesting week ahed of us with AAPL earnings after the market Tuesday, the F_O_M_C meeting concluding on Wednesday.

Here's next week's economic schedule...
Monday is quiet, from there the week gets interesting. I'm not even going to speculate on the F_O_M_C meeting, but as always, beware the F_E_D knee jerk effect.

Events in Europe are already taking an interesting turn, watch for yields in Italy and Spain as well as France as the French election heats up, it's looking like Sarkozy is in trouble from Sunday's first round of voting which may throw all of the EU's plans and commitments in to complete disarray should he lose, which is looking to be a distinct possibility.

As for the market, earlier last week we were looking for an options expiration SPY $140-ish pin, as explained in this post, the number of call contracts that increased hugely over a day or so, changed the pin and we didn't get the close I was hoping for, however the $.07 miss of $138 seems to make clear Wall Street was looking to pin a boat load of calls that came in Thursday from $138-$140.

I was hoping for a pin that looked more like this, keeping with the volatility/shakeout theme...
As was mentioned on April 10th before the bounce from below the SPX's 50 day moving average started, it simply doesn't make sense to have a bounce that doesn't shakeout the shorts and bring the longs in to the mix, a close like the one above would achieve that, we may still get that, it could be from AAPL earnings, optimism in to the F_O_M_C or even subtle wording changes in the policy statement.

Although the close on Friday seemed VERY deliberate (robbing $138 calls by a mere seven cents) and somewhat bearish, the underlying action late in the day seemed just as deliberate.

I noted the underlying tech action in this post Friday. Once again we saw a very fast moving market, although it was all in the underlying action.

Take a look at the Tech, Financial and Energy short (late Friday) and long term charts (significant deterioration continues).

 Energy sold off hard right on the open (Glad I closed the USO calls early in the a.m.). Energy looks to have the least amount of short term underlying momentum.

 The longer term 60 min Energy chart continues to lead negative.

 Financials showed a late day 2 min positive divergence it really grew in the last 15 minutes from an ambiguous jiggle to a leading positive divergence, it looks like smart money was very active in the last 30 minutes.


 a very long term daily chart of Financials shows them to be leading negative and in one of the worst positions since 2009 for just having had a big rally the last 5-6 months.


 Tech in the short term looks like the clear leader, we never did really get that strong tech rotation we expected. This is part of the reason I wanted to get some quick calls in AAPL, BIDU and PCLN late Friday.

Meanwhile the 60 min chart continues to reach for new leading negative lows and look at the price area in which this is happening.

As for the averages themselves, they too seem to confirm what Financials (to a lesser degree) and tech were hinting at late Friday (I included the very short term charts and the bigger picture longer term charts like the sectors above).

 DIA 2 min late Friday in the short term

 Longer term 60 min DIA, continuing to dig in to a deeper leading negative divergence.

 IWM 2 min with a positive short term intraday divergence, this looks to be one of the weaker short term divergences thus far

 The longer term 30 min which has been declining for some time now, just intensifying lately.

 QQQ 1 min late Friday

 QQQ 30 min showing increased downside momentum

 The SPY 2 min looks to be the strongest intraday positive divergence.

The sharp deterioration in the 15 min as well as the longer 30/60 min charts-even the daily is leading negative.

So it looks like the market is not done with volatility which I see no reason why it shouldn't continue to become more volatile as had been expected over a month ago and as we have seen.

I also find these divergences interesting considering the SPY closed right at the 50-day moving average, exactly where technical traders would be looking for support. What the market intends o doing with this, I haven't a clue at this point, but history being our guide, it probably won't turn out as traders expect.

I'll be looking earlier in the day tomorrow at the longer term risk asset layout since April 10th, which has been diverging except in Corp. Credit which has remained supportive of higher prices near term, just about everything else is digging in to deeper negative divergences. I suspect some sort of volatility induced trap to play out this week, I expected it Friday, but with Call options seeing a incredibly large increase, the market clearly intended on pinning the most number of contracts possible, again, the seven cent close below $138 in the SPY doesn't strike me as random.

Nearly all US economic indications are surprising to the downside, I have a new area for useful links on the right side of the site, just take a look at Citigroup's Economic Surprise Index.


While markets are just starting to open, we have some news beyond the French elections which will be more than just a change of leadership in France, likely a change is everything the EU has done to this point or plans on doing moving forward.

China's April HSBC Flash PMI came slightly stronger than expected but suggests manufacturing may remain in a contractionary state for the sixth month in a row. Remember that last month HSBC's Flash China PMI diverged badly with the actual Chinese print. Shortly we'll get China's take, however trivial this may seem, the HSBC reading and the Chinese readings have had a history of being similar, that was until about 3 months ago. While it may seem unrelated, there is a power struggle going on in China and the Chinese government's greatest fear is discontent among its own citizens. As Chinese standards of living have been moving higher, the possibility of a "not so soft landing" could have severe consequences and I don't think you can separate the Chinese economic data which has always been opaque (sort of like the early 2012 US data filled with seasonal adjustments, just multiples worse) from a quiet, but intense political clash unfolding in China; not to mention the many hints of citizen discontent and uprisings that just can't seem to be confirmed as China shuts down all media/bloggers who report on it.


The macro environment that is developing in the EU with Spain, Italy and France should be watched carefully as well as continuing trends in US economic data. The French elections could also have profound effects on Troika policy.


For now, we are still in the volatile, 1 day at a time environment where being nimble is key, but we are clearly seeing the market undergo a strong change in character. Without going in to breadth, Risk assets, Credit, rates, and everything else, a simple eyeball of the SPX should be enough to raise some alarm bells.


Have a great week, see you in a few hours.


Sunday, April 22, 2012

Another Test-please ignore

This is just a test

Please ignore this post, it is just a test


Thanks,

Brandt