Thursday, May 10, 2012

Market looks to be consolidating

I would think the market is consolidating here based on a couple of reasons, 1) the Euro consolidation, a break out and move above $1.30 would be bullish for the market. 2) There's a good deal of resistance in the immediate area, traders seeing that resistance hit and price back off from it would likely become emboldened to short the market which ultimately would be helpful for any bounce as they are squeezed.

Here's what the intraday action and the longer near term trend look like...

 10 min SPY chart, Tuesday formed a bullish hammer support zone, Wednesday the market closed above that support zone. Today resistance is around the yellow area, both gap and overhead, the market is likely to hold off and consolidate until the Euro makes its move. A break above $136.75 would be the start of a move higher.

 Here's the 5 min consolidation, note volume is in a consolidation phase as well.

 The 1 min intraday chart has shown positive divergences near the lower end of the range, as prices approach resistance, negative 1 min divergences set in, this is consolidation behavior.

The overall trend on the 5 min 3C chart looks good here as you can see price remains conolidative, but 3C continues to lead higher.

I would guess the first sign of a move will be preceded by a breakout in the Euro's consolidation.


Risk Asset Layout

First of all the 3C indications are improving o the intraday charts.

I didn't find everything I thought I might in the Risk Assets, but I found enough.

What is lacking thus far is a bullish move in Credit, the credit markets are much larger, much better informed, they either aren't buying the bounce as we have seen them negatively divergent at every previous bounce attempt that has failed or they simply haven't moved up yet, ultimately even if they do improve, they should be negative as a bounce matures. Credit leads equities.

As far as other findings...
 First commodities vs the SPX (SPX is always green unless otherwise noted). It looks like commodities are finally consolidating in a triangle, the currency charts will shed more light on this, but mainstream technical traders should interpret this as a bearish continuation triangle, it almost certainly isn't, therefore a breakout of the triangle should force a short squeeze in various commodities, remember yesterday we saw a pretty good looking FCX/Copper chart in which 3C was looking very much like a bullish reversal was near. A short squeeze would give commodities extra upside momentum.

 One of the bigger finds was in yields which went negative when we identified the last bounce failure on May 1st, since then Yields (which are like a magnet for stocks) have made a higher high and are leading the SPX, this is supportive of a bounce higher.

 The EUR/USD or Euro, has finally broken above the downtrend line that has been there since Monday.

 A closer looks reveals what looks like a small triangle-type consolidation, I suspect the Euro is trying to get some momentum to make a run for the very important $1.30 level which someone has been supporting for months, (perhaps the Chinese to keep exports affordable in Europe?).

 The $AUD is an excellent currency as a leading indicator, you can see how it broke down first before the SPX on the last bounce on May 1st to the left, it now looks like an inverse (bullish) H&S pattern and a likely breakout higher, which is supportive of the market in the near term.

 Intraday the $AUD has kept pace with the SPX fairly well.

 The Euro also broke down before the SPX on May 1st to the left and has reach short term reversion to the mean this morning, although the SPX is ahead of the Euro this a.m., I suspect the market is discounting a likely break of $1.30 as the Euro has already broken the downtrend line.

 Intraday the Euro has kept up well with the SPX, it is still lagging a bit, but as mentioned, I believe it is because it is consolidating for a move through $1.30.

This is GLD in green vs the SPY in red, you can see GLD has tracked the market at least directionally pretty well, so as I pointed out in yesterday's GLD update, GLD was looking much better for a bounce move yesterday, it would make sense that it moves with the market at least directionally, although relative strength will probably waiver depending on the sentiment toward Central Bank easing whether in the US, the ECB or something coordinated. It's important to distinguish between sentiment and probability.


 Here are the many gaps in GLD, the market trend has been to diligently fill gaps, so there are quite a few gaps to the upside that would be puling on GLD.

 GLD is also consolidating in a triangle, likely because of the arbitrage correlation to the EUR/$USD or more specifically the $USD, but the EUR/USD is a perfectly acceptable proxy.

 Yesterday I showed you a number of positive divergences in GLD, today it has gapped higher and during the consolidation the 1 min 3C chart is leading positive, suggesting an upside breakout.

 The 2 min continues to build and is leading positive currently.

 3 min GLD is leading positive during the consolidation

 The 5 min is as well

 And like all of the other 15 min charts shown last night, add GLD to them in a bullish leading positive divergence, suggesting a decent bounce here as well.

Finally, as shown also last night, the 15 min chart of TLT/Treasuries, which has been a flight to safety trade as the market has declined this week, is now even deeper in to a leading negative divergence, it seems they are abandoning the flight to safety trade and turning toward a risk on trade for our bounce.

ES Update

 After a premarket negative divergence at the highs ES with most of the market pulled back in morning trade, I've already received a couple of emails from people who track trader action and sentiment, one of my better sources sent me this:


"I'm following a bunch of traders on twitter, they were short into EOD
yesterday stopped out this morning on the gap up, they went long and now got stopped out on the long.  Now they are switching short again. Guess this is how wall street makes good money and when the bounce comes I think it's going to really catch the shorts off guard since this is bearish price action and honestly I would have gone fully short if it wasn't for 3c."


As explained yesterday, a short squeeze would be a key component in to any bounce and as I always remind you, "Price is deceiving".  This kind of reaction to the market is EXACTLY why we don't chase trades, but let them come to us.


The CONTEXT ES model is very supportive of higher prices and growing, I'm very interested to see what our "Risk Asset Layout" which is a more detailed form of CONTEXT has to say and where the underlying strength is coming from that is apparent in the CONTEXT MODEL. I'm going to take a quick look.

AAPL Update

 AAPL is in a nice triangle right now, up .65%.

 the 1 min chart is showing good confirmation.

 The 2 min has several positive divergences in the triangle.

The 15 min chart is still the best looking chart and the best chance for a move higher in AAPL

Market Update

 Dia 1 min is in line with price, over the last week or so, the DIA has had the weakest underlying 3C action, yesterday it started to make up for it.

 DIA 2 min is showing a decent positive divergence on the 11 a.m. pullback

 DIA 3 min chart has a leading positive divergence that has largely formed today.

 The DIA 5 min has also formed a leading positive divergence today.

 ES 1 min is also showing a positive divergence in to the lows.

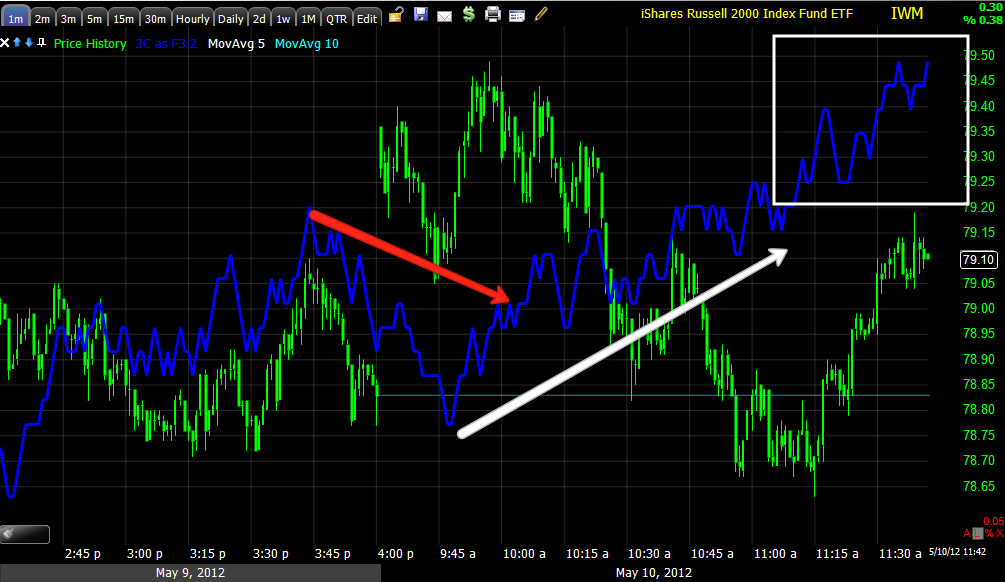
 The IWM 1 min is showing a leading positive divergence.

 So is the 2 min

 The QQQ 1 min is leading positive

 The QQQ 2 min is also leading positive

 QQQ 3 min is also leading positive.

 SPY 1 min is leading positive

 SPY 2 min leading positive

SPY 3 min is in a leading positive divergence.

The Bounce?

After seeing last night's 15 min positive leading divergences in a number of different stocks, obviously I felt confident enough to start some long trades looking for this bounce I have had a gut feeling would come and likely be the last, I've covered this scenario and expectations fairly extensively so I won't rehash it.

The overnight futures are what moved the market to gap up this morning, but the catalyst behind any improvement in the market is difficult to pinpoint based on the overnight activity. As mentioned, a 15 min divergence doesn't develop overnight and not in a day. Yesterday I put out quite a few posts about a rounding type bottom and the need for the market to gap higher to squeeze shorts, it seems this is a Wall Street orchestrated move as 3C is showing and not anything fundamental, which tells us what we have known for a while, Wall Street manipulates the market in the near term and has for some time. It's important to understand the reasons why and I think I've covered that fairly extensively as well.

As for the overnight data:

Despite having a solid quarter, shares of Cisco plunged 9% after hours yesterday when the company warned of a cautious business outlook, slowing revenue, and trouble in Europe on the company conference call. As always, earnings are not about what a company did, they are about expectations moving forward and CSCO certainly wasn't part of any catalyst for a bounce.


In Europe and China:


China posted a larger than expected trade surplus, but it was due to a greater than expected drop in imports.


 European industrial production was slightly better in Italy but offset by worse than expected news out of France. UK Manufacturing came in a little stronger than expected. 


In what can only be seen as bad news (unless you are looking for ECB stimulus), the ECB forecasters revised 2012 GDP estimates for the Eurozone downwards to -0.2% from -0.1%, and revised up inflation expectations for the year to 2.3% from 1.9%.


BoE keeps benchmark borrowing rate at 0.50% and APF at GBP 325bln; as expected.

We heard about a letter of memorandum yesterday between Syriza, the anti-bailout party and PASOK, Greece’s PASOK leader Venizelos has taken the mandate and will attempt to form a coalition government. Each party starting with the New Democracy has had up to 3 days to form a coalition government, each party leader with Syriza yesterday (whose turn it was) has thus far given up in less than a day.

The focus will remain on Greece as the PASOK leader Venizelos grabs the baton and now attempts to form a stable coalition. Venizelos has reiterated that he wishes to remain within the Eurozone and affirmed that his party has not changed its policy with respect to the bailout.

The worst possible outcome is a new round of elections if a coalition government can't be formed, it looks VERY unlikely that one will be formed at this point with the 3rd place party now trying their hand at coalition building against the odds of voter sentiment.

Furthermore, as Reuters reports, "Greece's jobless rate hit a new record in February, underscoring the pain austerity policies required by the EU and IMF have inflicted on the debt-laden country which is struggling to form a government. More than one in five Greeks and one in two youths are out of a job, statistics service ELSTAT data showed on Thursday. The unemployment rate hit 21.7 percent from a revised 21.3 percent in January. In the 15-24 age group, joblessness stood at a record 54 percent."

There are less than 4 million people who are working to pay off the country's bailout package and debt which at last check was about 200% of GDP.

Italy's Q2 GDP is now expected to shrink more than 1% in Q2: the worst print since 2009, cementing the country's "double dip".


Still the focus remains on Greece.

The Spanish IBEX index jumped 3.5% in European trade, most are attributing this to an oversold bounce, however there is speculation that Germany may be ready to abandon their long standing resistance to anything inflationary and back ECB outright printing of money.

 Thus ES's negative action near the EU open was choppy and slightly negative.


In the US...

The subterfuge continues...

Initial Claims

Released On 5/10/2012 8:30:00 AM For wk5/5, 2012
PriorConsensusConsensus RangeActual
New Claims - Level365 K366 K360 K to 380 K367 K
4-week Moving Average - Level383.50 K379.00 K
New Claims - Change-27 K-1 K


 Last week's 365K number has been revised higher to 368K, which is where the expectations for this week's print were. Instead, we got 367K claims this week, which because of the revision higher, the financial media will report a headline: "Initial Claims improve by 1,000." even though it is only because last week's data was revised to the upside (worse!).


The same thing happened for continuing claims, which beat expectations of 3275K, printing at 3229K, with the last week's print revised to 3290K from 3276K. The more disturbing form an end demand standpoint data, is that yet another 40K dropped off extended claims and EUCs. Finally in what is the best news for the market, and worst for the Economy, is that the March trade deficit soared to $51.8 billion, on expectations of -$50 billion, which was the biggest trade balance drop in 10 months. What this means is that Q1 GDP which already is tracking at 1.9%, just got lobbed to 1.5%. Yes: the Q1 GDP first revision will likely show the 2.2% number is now in the low to mid 1% range.


None of this seems to be a catalyst for the market to move higher leaving us only with what we have seen and knew before any of these events occurred, which would be charts like the ones featured in last night's market wrap.

It seems clear that any move higher in the market was pre-determined and planned by Wall Street. It is important to understand the degree of manipulation of the market and why.

Hopefully the indications in 3C will hold, we sill see higher prices and be able to short in to them. Just remember, should we see what appears to be a VERY strong bounce, why this is occurring and that price above all right now is deceptive.


Market Update

 DIA is in line after a closing positive divergence yesterday

 The IWM opened in line and has a positive 1 min divergence developing now.

 The QQQ opened in line and is showing a positive 1 min divergence developing now

The SPY opened in line and remains in line at this moment,
So far, so good

The Bounce? More importantly the game...

In last night's post I presented you with a number of charts that showed positive divergences that went out to the 15 min chart in a number of stocks, market averages, and other risk on and off (Safe haven trades like Treasuries) that suggested not only were we finally getting the best, the clearest signal that we have had since the May 1 decline, they also suggested this bounce (which I have expected to occur and be probably the last bounce) that has thus far started with a gap up this morning.

I'm trying to put together a bigger post, it is taking some time, but the intent of the post is to show why there's no real catalyst in the market's for a bounce.
The point being, it takes the 15 min charts some time to come up with such clear, strong signals, it didn't happen in a day, it certainly didn't happen overnight. I think, while this post I am working on will not be useful in the near term market action, will reveal to you the true nature of the stock market and just how manipulated it is. I am taking the time to put this together because I think it is critical for you to understand this concept so you may apply it to your methodology. You must understand that what you see in price is not what the true picture actually is and what your favorite indicators are telling you are likely useless or coincidental. You have to learn to follow the footsteps of elephants and understand what they are capable of and the true nature of the market is you ever truly want to beat it.

I'm not taking any victory laps for the post last night and the open this morning, it is way to early to entertain thoughts like, "We were right!", but we are thus far on the right track. It is important you understand the reasons.

I'll be updating while I try to get this larger post together, but for now, lets just look at the overnight market price action alone in ES (The S&P E-mini Futures).

 This was a positive divergence in ES after the close last night.

 This is a negative divergence after ES had gained that ocourred at the European open, you will understand why more in the next post.

 This is ES overnight, and the reason we gapped up this morning.

 Note that CONTEXT conditions improved supporting ES, but largely overnight when they would be least expected to improve.

And here's out gap up.

I'll update the opening indications and continue on with the other post.