First of all the 3C indications are improving o the intraday charts.
I didn't find everything I thought I might in the Risk Assets, but I found enough.
What is lacking thus far is a bullish move in Credit, the credit markets are much larger, much better informed, they either aren't buying the bounce as we have seen them negatively divergent at every previous bounce attempt that has failed or they simply haven't moved up yet, ultimately even if they do improve, they should be negative as a bounce matures. Credit leads equities.
As far as other findings...
First commodities vs the SPX (SPX is always green unless otherwise noted). It looks like commodities are finally consolidating in a triangle, the currency charts will shed more light on this, but mainstream technical traders should interpret this as a bearish continuation triangle, it almost certainly isn't, therefore a breakout of the triangle should force a short squeeze in various commodities, remember yesterday we saw a pretty good looking FCX/Copper chart in which 3C was looking very much like a bullish reversal was near. A short squeeze would give commodities extra upside momentum.
One of the bigger finds was in yields which went negative when we identified the last bounce failure on May 1st, since then Yields (which are like a magnet for stocks) have made a higher high and are leading the SPX, this is supportive of a bounce higher.
The EUR/USD or Euro, has finally broken above the downtrend line that has been there since Monday.
A closer looks reveals what looks like a small triangle-type consolidation, I suspect the Euro is trying to get some momentum to make a run for the very important $1.30 level which someone has been supporting for months, (perhaps the Chinese to keep exports affordable in Europe?).
The $AUD is an excellent currency as a leading indicator, you can see how it broke down first before the SPX on the last bounce on May 1st to the left, it now looks like an inverse (bullish) H&S pattern and a likely breakout higher, which is supportive of the market in the near term.
Intraday the $AUD has kept pace with the SPX fairly well.
The Euro also broke down before the SPX on May 1st to the left and has reach short term reversion to the mean this morning, although the SPX is ahead of the Euro this a.m., I suspect the market is discounting a likely break of $1.30 as the Euro has already broken the downtrend line.
Intraday the Euro has kept up well with the SPX, it is still lagging a bit, but as mentioned, I believe it is because it is consolidating for a move through $1.30.
This is GLD in green vs the SPY in red, you can see GLD has tracked the market at least directionally pretty well, so as I pointed out in yesterday's GLD update, GLD was looking much better for a bounce move yesterday, it would make sense that it moves with the market at least directionally, although relative strength will probably waiver depending on the sentiment toward Central Bank easing whether in the US, the ECB or something coordinated. It's important to distinguish between sentiment and probability.
Here are the many gaps in GLD, the market trend has been to diligently fill gaps, so there are quite a few gaps to the upside that would be puling on GLD.
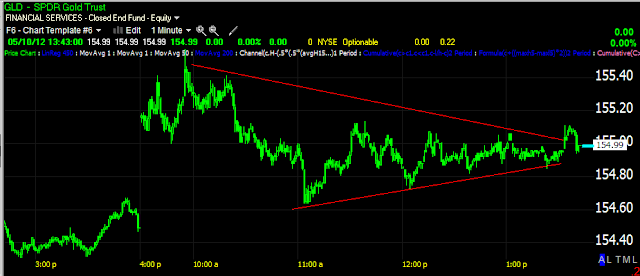
GLD is also consolidating in a triangle, likely because of the arbitrage correlation to the EUR/$USD or more specifically the $USD, but the EUR/USD is a perfectly acceptable proxy.
Yesterday I showed you a number of positive divergences in GLD, today it has gapped higher and during the consolidation the 1 min 3C chart is leading positive, suggesting an upside breakout.
The 2 min continues to build and is leading positive currently.
3 min GLD is leading positive during the consolidation
The 5 min is as well
And like all of the other 15 min charts shown last night, add GLD to them in a bullish leading positive divergence, suggesting a decent bounce here as well.
Finally, as shown also last night, the 15 min chart of TLT/Treasuries, which has been a flight to safety trade as the market has declined this week, is now even deeper in to a leading negative divergence, it seems they are abandoning the flight to safety trade and turning toward a risk on trade for our bounce.
Is interest rates about to start going up?
-
Yes, I know - it does not make any sense - FED is about to cut
rates...but....real world interest rates are not always what FED wants it
to be.
6 years ago


No comments:
Post a Comment