Thursday, July 5, 2012

SPY / ES Market Update

As you may recall, Tuesday I said, "Thursday may look very different than today" on expectations of a pullback that have been in place since last Friday. Here's ES and the SPY with more updates to follow.

 It looks like someone knew something about Draghi's intensions as ES hit its highs in to a negative divergence pre-U.S. regular hours opening. There's a VERY slight relative positive divergence in effect, I don't think it carries much weight, but I've never been a fan of a.m. trade as it can be very misleading.

 SPY 1 min negative divergence from Tuesday with the same relative positive as ES.


 The 2 min negative divergence from Tuesday's close, note there's been no migration of the 1 min positive divergence in early trade to the 2 min chart, this is why I think it is not very strong.

 The SPY 3 min negative divergence in to Tuesday's close, no hint of a positive intraday this a.m. here either.

 The 5 min negative on Tuesday at the close and leading negative this a.m.

And the SPY 15 min chart which gave us the first expectation of a pullback last Friday with a negative divergence on the 29th.

More updates coming...

Back to it...

While we celebrated the 4th, the rest of the market slowly turned.

Knocking the Shanghai Composite around yesterday was Chinese Services PMI which came in at  10 month low, giving more evidence to a string of bad either official or HSBC Flash PMI readings in both Manufacturing and Services. The actual report was higher than consensus, but the slowest pace in 10 months; the bottom line is the same as it has been since mid-2011, China is in more trouble than their opaque government lets on.

The Euro-area ISM Services Composite reading of 17 EU countries came in at 46.4, slightly above expectations of 46, but well below the 50 level which signals contraction in Services as well as Manufacturing saw earlier in the week. This is the 5th consecutive month of contractionary readings for the Euro area Composite in both services and manufacturing.

Germany surprised a few as German Service Sectors report contracted to 49.9 on consensus of 50.3 (contraction below 50). Spanish and Italian 10- year yields crept up yesterday on the news. In contrast, the Irish 5 year yield fell as the Irish government announced they'd be back in the debt markets selling treasuries for the first time since 2010.

Yesterday the Stoxx European 600 and the DAX were down -0.50% and -0.60% respectively.

Sovereign Yields have not been helped by the news from the German Finance Ministry, 


"It remains unclear if Eurozone finance ministers will decide on Spain's request for banking sector aid at their next monthly meeting on July 9."


 This comes after divisions arose in German politics with the CDU's main opposition party, the SPD opposed the plan to allow Europe's permanent rescue fund, the European Stability Mechanism (ESM), to directly recapitalize banks. You may recall this was one of the key agreements reached at last week's EU summit, but as usual, these summits propose grand ideas that the market takes as the gospel without realizing that each individual member country must pass, ratify or otherwise agree with the terms, this is why EU summit headlines are typically little more than temporary market moving events. It must have been at least a month ago since that 2 hour Finance minister weekend call that promised Spain $100 bn Euros to re-capitalize their banks, yet it is still not agreed on and the ESM is still not ratified.


Furthermore, the Troika is now expected to make its own assessment, originally the Troika was not to be involved after the IMF and private Spanish banking system audits. It never fails, grand EU plans always fall flat on their face. The fact still remains that even if the EFSF (temporary bailout fund) and the ESM (permamnent bailout fund) were both fully capitalized (which Finland, Holland and Slovakia seem to oppose in one form or another) and running simultaneously, there still isn't enough money to deal with Spain and Italy. In addition, this morning Finland made news as they contine down the road they have been clearly moving toward. As Bloomberg reports this morning of July 5th:


"Finland is contesting the wording of an agreement struck last week in Brussels, arguing it doesn’t adequately address the possibility that loans to Spain from Europe’s permanent rescue fund can give taxpayers seniority.
A June 29 statement from the 17 euro-area leaders stripping the European Stability Mechanism of its preferred creditor status in Spain was incomplete, said Martti Salmi, a Finnish Finance Ministry official. The 100 billion-euro ($126 billion) bank bailout could provide seniority to contributor nations if fresh funds are transferred by the ESM, he said." 
So, as mentioned above, Summit headlines are one thing, reality is another-Watch those sovereign bond yields in Spain and Italy!
On the Syrian/Turkish/Nato front, the two pilots originally shot down on June 22nd after crossing into Syrian airspace were discovered yesterday, dead in the Mediterranean Sea. Since the event there have been daily scrambling of Turkish fighter jets to the Syrain border.

As of July 5th... 


First in Asian, the Japanese Central Bank (BoJ) has upgraded the 9 Japanese regional economies which is the first upgrade from the BoJ since 2009.


In the EU, German Factory Orders came in better than expected at +0.6% on a month/month basis (since May) with consensus at 0% and the previous at -1.9%. However price action in Europe remained muted as the Central Bank decisions from the ECB and BOE (Bank of England) were awaited.


Brent and WTI crude gained some ground after losing some upon the release of Chinese economic data on July 4th, after the Norwegian pension negotiations for oil workers is still unresolved and as a result, locks out some 6000 oil workers with an expected drop of 1.2 mn barrels a dat from Norway.


Around 12 p.m. local time the BOE did meet market expectations by increasing (QE) or asset purchases to a target of an additional $50 bn Pounds and leaving interest paid on bank reserves as is at .50%. 


The real SURPRISE came only moments before as China's PBoC announced,


"The People's Bank of China decided to cut financial institutions RMB benchmark deposit and lending interest rates since July 6, 2012. One-year benchmark deposit rate cut of 0.25 percentage points, year benchmark lending interest rate cut by 0.31 percentage points; other deposit and lending interest rates and individual housing provident fund deposit and lending rates be adjusted accordingly."


This move sent ES popping higher as it was unexpected, there was chatter earlier in the week of a Reserve Requirement Ratio cut coming, but the cut announced this morning pre-market was a surprise.


As for filling out the Global Central Banking coordinated movement today, the ECB cut its benchmark rate by 25 basis points to .75% as expected. The ECB also moved the deposit rate to 0%, perhaps trying to finally ignite the carry trade intended by the ECB LTRO 1 and 2 loans to banks as the deposit interest rate is stripped away.


Futures started sliding as Draghi says during the public statement portion of the rate decision, "There will be no LTRO 3", which is perfectly understandable as EU banks have no assets left to pledge as collateral.


The Euro's reaction...


Gold which is a reflection of easing bias in the markets also fell on the Central Bank actions.


 In the US, Initial Claims were released at 8:30


Released On 7/5/2012 8:30:00 AM For wk6/30, 2012
PriorConsensusConsensus RangeActual
New Claims - Level386 K386 K375 K to 395 K374 K
4-week Moving Average - Level386.75 K385.75 K
New Claims - Change-6 K-14 K
Initial Claims finally beat after 6 weeks of misses.

At 10 a.m., US Non-Manufacturing ISM missed
Released On 7/5/2012 10:00:00 AM For Jun, 2012
PriorConsensusConsensus RangeActual
Composite Index - Level53.7 53.0 51.5  to 54.0 52.1 

You may recall US Manufacturing ISM missed earlier this week, now services follow.

This is the 3rd consecutive miss in Non-Manufacuring ISM, however it did manage to print above 50.


Market updates are on the way...


Tuesday, July 3, 2012

BPZ Update

BPZ was a long idea from June 18th.,  subsequent updates on June 22 and #2

 Here's the original trade idea the day after what looked like mini-capitulation. With the downtrend and the bearish continuation triangle, in retrospect, I should have waited for the bear trap to set up and buy in to that weakness.

Since we didn't have an uptrend to work with until the June 22nd update, we used the hourly Trend Channel which has held the entire move thus far, the trade is up about 14% right now.

The current charts...
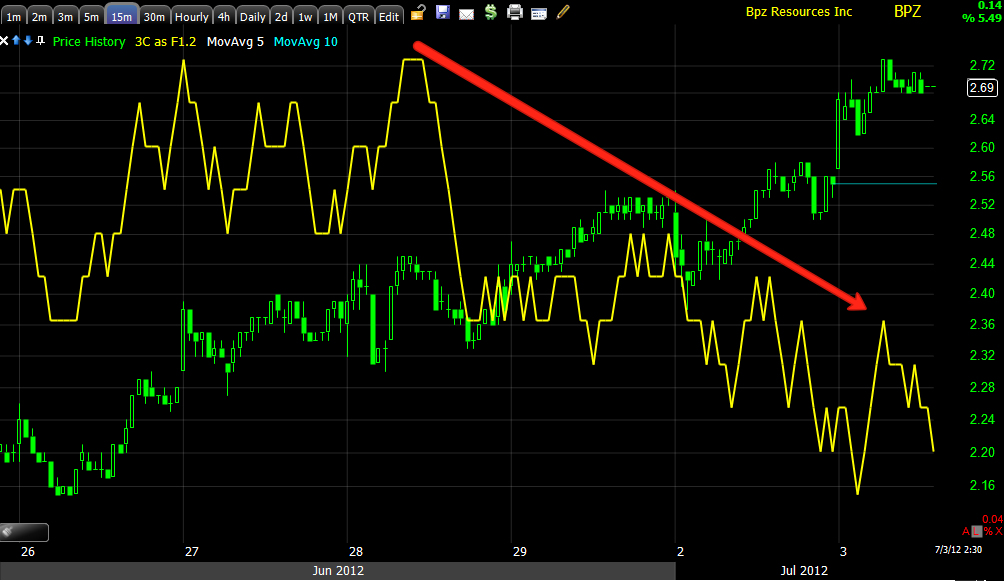
 BPX is starting to look like it has the potential to be a longer term trending trade as this is one of the few stocks out there with a positive divergence on a daily chart, or the primary trend.

 The 4 hour chart from distribution to a leading positive divergence (accumulation).

 The 60 min leading positive would be more than impressive, but with the 4 hour and daily, BPX looks to be something special in this market.

 The 30 min chart offers more detail as it should, it is also leading positive.

 As for a pullback, the 3 min went from a relative negative divergence to a slight leading negative today.

 The negative divergence stretches out to the 15 min chart, which is basically in line with the market averages. I have mentioned many times how the market is the primary driving force behind any given stock on any given day, but over the last several months we have seen an extraordinary amount of correlation, stock pickers can still do their thing, but the amount of market correlation makes stock picking somewhat futile at the moment, it's only stock like this that stand out on a daily chart that are really standing out from the strong correlation in the market.

 I would look for a pullback somewhere around the $2.50-$2.55 level, which means our 60 min stop will have to be adjusted to a wider daily stop, which would have been necessary any way for a longer term trending trade.


Here the 60 min x-over chart to avoid false crossovers gave a recent signal and remains in line as a long trade. We may have to move this out to a daily chart as well soon.

I would definitely keep this one on your radar for a pullback.


Risk Assets, Credit, Commodities, Yields, Currencies, etc.

 Commodities vs the SPX, gold and oil were obvious out-performers today, but nearly across the board and as you'll see in Basic Materials in the sector rotation map, commodities as a whole did well despite their losing the FX correlation.

 Most commodities are effected by the $USD in an inverse manner, since it's more difficult to see inverse divergences I use the Euro as a proxy as it makes up 50% of the US Dollar Index and is a pretty reliable proxy. Here the Euro is in green, commodities and the Euro should be moving roughly in sync, the last two days the commodities have been stronger than you'd expect considering the $USD. Strangely however, commodities have basically pulled up to a correlation with the Euro's close from last week. Unless something happens in Europe tomorrow to send the Euro higher (the European markets saw a bit of a short squeeze the least 30 mins of trade today), than commodities and the market both seem to be overextended and missing that FX support, but all kinds of correlations can be easily broken during a short squeeze which is nothing short of an emotional panic as we have been updating you over the last month on the record bearishness and in our opinion how these bears were going to be burnt before the market resumes a primary downtrend.

I hope you can now see the logic in my thinking when I decided to keep the core shorts which 5 of 6 are in the green with only 1 at a minor loss of less than 1% (in case of a black swan event) and added leveraged longs when the market was near its lows in anticipation of a short squeeze. As I was saying back then, "There are too many people on one side of the boat and in a zero sum game, Wall Street can't make money allowing that to go on".

Nothing has changed with regard to the sub-intermediate and long term outlook. If all goes according to plan, the shorts are hedged, the longs will make money (actually are all making money except 1) and when the time comes, the longs will be sold at a profit, we may add some shorts or fill out existing positions and prepare for the next primary leg down.


 High Yield Credit is the risk asset in the credit markets, today it was a little out of sync with the market which is fine, especially if we are looking for that pullback to materialize.

 High Yield Corporate Credit was off yesterday, it's back in line today.

 Although Yields made an attempt today, they are still negatively divergence, if the market pulls back and there's some reversion to the mean between the two, we are fine, if the market keeps moving higher with yields continuing to diverge, we'll have a very unstable move up.

 The $AUD was perfect today, no problems there.

 The Euro made an attempt, but still remains divergent.

Sector momentum today saw Energy, Basic Materials and Industrials do very well, Tech came in toward the end of the day, Discretionary fell off and Financials were roughly stable. The flight to safety trades were out as you'd expect-Utilities, Healthcare and Staples.

SPY/IWM

I mentioned earlier in the week the IWM tends to be the leader of risk on moves, we saw that as the IWM shaped up quite a bit yesterday. The most underlying movement today has been in the IWM and SPY...

 If you look at the IWM 1 min price chart you can see where the short squeeze momentum was in effect, as the 1 min started leading negative you can clearly see the loss of momentum in the short squeeze that started yesterday afternoon.

Adding ROC to price makes this even more clear.

IWM 1 min with ROC applied to price.

 This is the migration through the timeframes or the process of distribution, there clearly was selling in to price strength, we can't differentiate between selling and short selling, but there's a possibility there was some short term market maker/HFT short selling if we are to get a pullback Thursday as the US markets are closed for the 4th of July.

 The 3 min in the IWM. It would be interesting to see how this would have played out during a full day, if the negative divergences would have grown worse and if the migration would have continued. I suspect it would have. Thursday's very fast accumulation is still in my mind and I think it can't be separated from this move since. However, I have the gut feel that if the short squeeze were to continue this Thursday, we wouldn't have seen an event and very quick strong accumulation, but rather a process with longer duration (thus a larger institutional long position).

 SPY 1 min leading below yesterday's readings

 SPY 2 min also leading below yesterday's readings.

SPY 3 min leading negative.

Now I'm going to check and see what happened in the risk asset layout.


ES Update

Volume is exceptionally thin and by this time most traders are off to the Hamptons with the machines running things.


ES has a small positive divergence here after seeing a large leading negative divergence, this move looks like fluff.


Financials/XLF

 1 min leading neg.

 2 min leading neg.

 3 min now leading neg.

 5 min still suggests a pullback

The 15 min overall looks good for the sub-intermediate trend to continue, but it looks like a pullback first.

Financials Update coming next

To answer several emails at once, there's continued 3C deterioration in Financials.

Charts coming...

USO

I've received several emails about USO, while I don't like USO up here especially where the EUR/USD is relative to USO and with the EIA report due out Thursday (as we have been near capacity for the last several weeks), I feel there's too much event risk in USO which is what it is responding to despite the legacy arbitrage FX correlation.

I also don't like USO long for the reasons stated above, I'd be patient with it because as of now, I see it as a gamble, not a high probability trade backed up by hard charts.

GLD Open

I decided to go with August $160 puts