Monday, July 9, 2012

MARKET UPDATE-Opening Indications

Not much has changed for the very short term outlook (meaning roughly today) since Friday. On the open, the short term 3C charts for the averages are either in line or slightly better than in line while the slightly longer intraday timeframes continue with Friday's leading positive divergence which suggested to me some backing and filling in to Friday's gap.

 DIA 1 min is slightly better than in line on the open with a slight leading positive divergence.

 The DIA 3 min chart remains leading positive, suggesting near term upside.

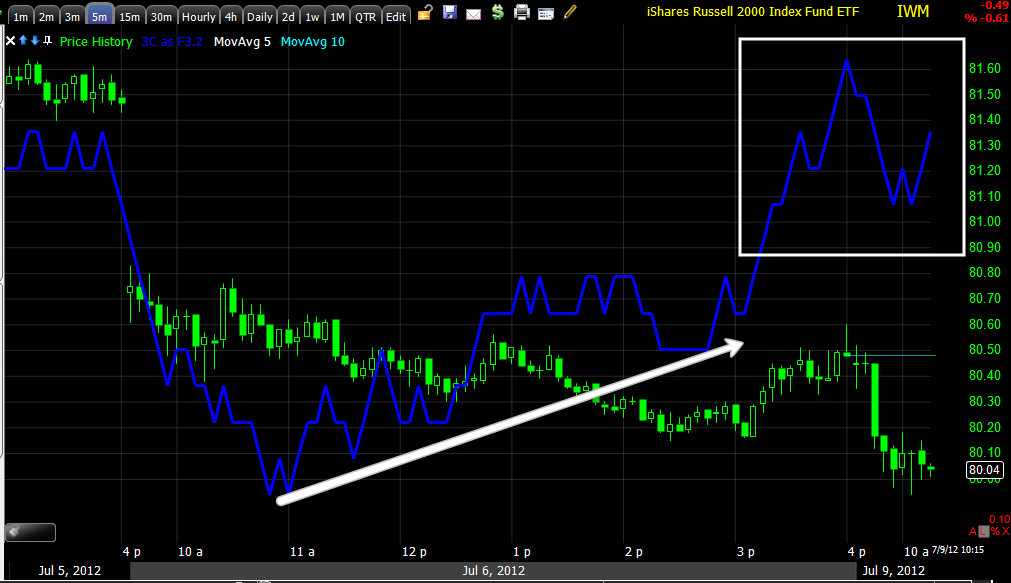
 The IWM 1 min opened to a leading positive divergence, not confirming price.

 The 5 min chart is still in a nice leading positive divergence started Friday.

 QQQ 1 min opened better than in line with a slight leading positive divergence, not confirming the downward move in price.

 The intraday 3 min chart is also still leading positive from Friday's building divergence throughout the day.

 The SPY 1 min is nearly perfectly in line with price (confirmation).

However the next longest timeframe at 2 mins. is still leading very positive, again this is an intraday timeframe and as such suggests shorter intraday moves, perhaps as long as a day and suggests some price strength likely in to Friday's gap.

Overnight and in to the open

Last night or earlier this morning, Chinese CPI reading came in lower than expected hitting a 29 month low of 2.2%, with a little dampening effect on sentiment. The Japanese government also lowered their forecasts for the economy in Japan broadly.

As was the case over the weekend, there wasn't much market moving news out of Europe overnight. The only notable news overnight was the Spanish region of Valencia said they may default if they don't receive government aid quickly; as a result, Spanish and Italian banks are trading down on average about 3% with Spanish 10 year yields above 7% given the comments from the region of Valencia.

Before US pre-market there was news that the EU granted Spain a 1 year extension to meet budget targets as well as lifting the targets from 5.3% by 2013 to 6.3% by 2014 as the Spanish economy has deteriorated badly in recent months.

Also before the US pre-market, there was a minor move higher in EUR/USD on a rumor reminiscent of last week,

EU SAYS NO SOVEREIGN GUARANTEE NEEDED FOR DIRECT ESM BANK FUNDS


I wouldn't read to much in to this, just the EU sewing circle at it again.


Dovish comments from the F_E_D's Evans about the need for more easing to combat unemployment gave a boost to fixed income and saw 10-year Treasuries trading higher.

Crude mentioned last night, which was seeing some momentum lost that momentum in to the European open.

Market trade has remained relatively thin and flat, the Eurogroup does meet today which is not expected to produce any major breakthroughs.

We do have Alcoa kicking off earnings season after the close.

Overall focus in Europe remains on yields in the periphery and the Eurogroup meeting to discuss Greece, Spain and banking supervision.


Other than that, most news out of Europe continues to focus on the widening Libor scandal.


Here's what the EUR/USD and ES looked like overnight to present.


 ES from Friday's close to Europe's 3 a.m. EDT open...

 And approximately from 9 p.m. Sunday to present, all in all pretty flat with about 3 points of downside from Friday's close to the 9:30 NY open.

The EUR/USD is relatively flat from Friday's FX market close (the new week's open at the green arrow).


I don't expect much movement from the Eurogroup meeting, however in a dull market like this rumors will be all the rage as they are picked up, ran with and promptly dumped as they are refuted-a common theme in a macro economic environment like this. AA may have some market moving implications as they kick off earnings, we'll take a look at AA today and see if there's anything of interest there before earnings after market.


The Week Ahead

Last week we saw thin markets (due to the US 4th of July holiday Wednesday) starting to retrace or discount the disappointment that has followed last weekend's EU summit. As usual, the summit promised more than it (at this point) can deliver and the markets started to realize that as several Northern EU countries (almost entirely based on the North/South divide with the Northern countries having the most influence and the Southern countries in the most economic trouble) started putting out the word that they are not agreeable to the Summit's conclusion which the market favored. Probably the biggest disappointment were the numerous comments from Northern EU countries, which in essence tore apart the optimistic tone the EU summit had set, specifically with regard to bailout conditions being loosened for countries like Spain and their banking bailout and perhaps more importantly the issue that had plagued debt yields in the PIIGS countries (especially Spain and Italy) regarding the ESM bailout mechanism's debt repayment seniority. When the first EU Finance Minister's meeting of several weeks ago decided on a $100 bn euro bailout for the Spanish banking sector, the hopeful optimism was short lived when the market quickly realized that sovereign bond/debt holder's right to payment would be subordinated by ESM loans to the same countries.


The EU summit of last weekend sought to address the issue which had sent Spanish 10-year bond yields over the critical 7% level (as they sold off on the ESM subordination reality), specifically the summit called for the ESM's seniority status to be repealed, a complicated issue that may require an entire re-work of the ESM (EU's permanent bailout fund-still not operational as Germany still has not ratified the ESM) which would lead to many individual countries to have to go through the process of voting and ratifying the new ESM (stripping the ESM's debt seniority in an effort to try to assure bond traders and get sovereign debt yields which are in unsustainable territory back down to more sustainable levels). The issue may sound like a technicality, but in reality it could be the difference between Spain going from needing a banking sector bailout to a full-blown sovereign bailout as the unsustainable yields lock Spain out of the debt markets with Italy trailing not too far behind.


In any case, last week the various statements of those who hold the purse strings and real power to influence the ESM (mostly the Northern EU countries) quickly deflated the post E summit enthusiasm as once again, the EU announces grand plans without any seeming contact between the major power players before making such promises, only to find out after making such grand statements that there is little agreement; as such, last week we saw the post EU summit enthusiasm fade. For those of you who have been following the macro trends in such matters over the years, this is nothing new; think back to the agreement among EU member countries to leverage the EFSF (temporary bailout fund) to a trillion dollars, yet there were to details as to where the money wold come from and in fact the EFSF had an offering to raise a mere $3 billion euros which was a technical failure-how did they expect to get to a trillion when they couldn't even cover a $3 bn euro offering? This has been a hallmark of EU summits and Finance Minster meetings, announce grand plans with no details and then watch the enthusiasm crumble as reality takes hold.


Further deteriorating market sentiment last week was disappointment that Central bank decisions came in at consensus rather than a more optimistic view that more easing would be introduced.


In a sign of the times, the 26 EU countries that are supposed to have free and open borders , are now introducing border controls. It seems apparent that countries are concerned about flight of capital from weaker countries to more safe haven countries, an extension of the bank run theme exacerbating problems for those countries already in deep economic trouble as well as citizens from weaker countries with high unemployment seeking work in some of their stronger neighbor countries-so much for the  Schengen and Amsterdam treaties.


We also found out last week that as a result of the ECB cutting its deposit rate to 0%, JP Morgan, Goldman Sachs and BlackRock have either restricted or closed new subscriptions to EU Money Market funds, it's obvious that new and existing investors face losses with the ECB's deposit rate at 0%, seemingly a move to encourage EU banks which have been hoarding cash within the ECB's deposit facility as a flight to safety; the banks (many which took ECB LTRO money at 1% interest) were willing to take a loss to protect capital (1% interest paid on 3 year ECB loans which were deposited in the ECB at a record setting all time highs to earn .25% interest-realizing a -0.75% a year loss). The rate cut seems to be a tool (however weak) that the ECB is using to try to get money flowing through the EU economies as the EU financial system has become increasingly frozen. The ECB's own SMP bond buying program (in the secondary markets) has been shut down for nearly 4 months, it seems obvious the ECB is hoping some of this deposited money will move in to the EU economy, however a more disturbing question is the lack of any ECB SMP movement, how bad is the ECB's balance sheet?


Of course the US as well as many other nations across the world and in Europe saw quite a bit of bad news on the manufacturing and services front. Last year we discussed the myth of US decoupling from the world and EU economies as the US started the year with rather good economic data. As was pointed out at the time, the early year seasonal adjustments were the reason for the better US data as many seasonal adjustment were purely arbitrary, once we moved out of the seasonal adjustment period, the true tone of US macro-economic data was revealed and was much worse than earlier data (manipulated by seasonal adjustments) suggested. It seems we can now put the US "De-coupling" myth to rest as the negative surprise index for the US has joined the European negative surprises-note the change in early 2012.


Once the US moved out of the seasonal adjustment period, the negative surprises increased dramatically. For anyone who dug in to the early data and the sub-indices within the data, the truth was there all along.


As for this weekend, other than some stories about banks and the Libor mess, the EU has been rather quiet with no summits or Eco-Fin meetings. As such, ES's open today has been rather uneventful.


We did see some news out of Saudi Arabia in which government authorities used live ammunition during a Shiite protest in Qatif in which a senior Shiite opposition leader was shot and arrested, leading to several casualties. This is the same region that was the source of tension in the Kingdom during the MENA revolution that started in Tunisia, followed by Egypt, Libya, Syria, etc. Crude futures are slightly higher than Friday's close, not by much, but off the opening trade of the week by nearly +1% as of right now.


ES is relatively flat, the EUR/USD is slightly higher than Friday's close, but not by much.


 ES trade from Friday and the opening indications for this week (light blue background to the right)

 A closer look at ES tonight, relatively flat and uneventful, of course the 3 a.m. EDT EU open may change that.

 The EUR/USD open last week at the red arrow and the open this week at the green arrow.

 On a 60 min chart you can see what I talked about last week, the normal risk on correlation in which the Euro and the SPX typically move together was broken suggesting little support for continued market upside in the very near term without a pullback.

The EUR/USD open this week at the green arrow.


As for the different trends and expectations from 3C charts as of Friday...
 The 30 minute SPY chart shows a decent negative divergence, suggesting a decent pullback.

 Friday we saw some intraday positive divergences develop on this 5 min chart and later in the day price reacted by moving up in to the close. It seems to me by the chart that the most likely short term path (perhaps Monday or intraday Monday) is a little backing and filling up in to Friday's gap.

Friday's late day positive intraday divergences and eventual relative closing strength seems to be based largely or entirely on the WSJ's Jon Hilsenrath's comments that essentially said the weak jobs data increases the likelihood of F_E_D easing later in the year, BUT doesn't guarantee it. Although Hilsenrath is considered by many to be the F_E_D's unofficial rumor leaker, the actual statement is nothing new at all. It has been pointed out MANY times here that weak data is looked at favorably by those looking for F_E_D easing or QE, gold itself has been a barometer of this sentiment for some time as it is would be one of the biggest beneficiaries of further dollar debasement. In other words, Hilsenrath's comments were nothing new and certainly far from anything definitive with the "But" caveat. It's actually kind of silly that the market would move on this news from the WSJ, but seems to explain our intraday positive divergence and subsequent move off the lows of the day.


 I question whether the positive divergence that seems to have been formed on insider knowledge of the Hilsenrath comments, will hold through Monday, the 5 min chart does look like it has more upside in and of itself.


 The longer term 4 hour chart at this point, still indicates there should be more eventual upside before we see a primary downtrend seriously re-emerge. The market this week was in short squeeze territory and we did see a few intraday short squeeze moves, however based on all of the analysis (including FX and our risk asset layout), I doubt very much we see a short squeeze without a fairly significant pullback first.
The long term primary 3C trend is quite ugly and it looks like the most likely path ultimately will be a resumption of the primary downtrend that just barely started from the March highs.


As I noted Friday, on a 4 month or so basis, the market has done pretty much nothing, it has been very volatile and choppy which has made long term trades difficult and short term, nimble trading quite effective, although some leverage such as options is necessary to make the moves worthwhile.


As far as a game plan, much will depend on your own trading style, risk appetite, ability to watch the market, etc. If we see some short term strength Monday, that could be use to set up some quick short trades for a downside move or pullback. Should we see positive divergences as I expect we will eventually see in to a pullback, that should offer opportunities to buy some long positions on the cheap for a final move higher and a true short squeeze, should we get this true short squeeze, it could be quite profitable with a sharp move to the upside. Ultimately we'd want to be looking at the end of a move like that to establish or add to core short positions for the resumption of the bearish primary trend which is where we'd likely see the best chance for longer term trending trades.


Of course this is what the market looks like right now and we want to listen to the message the market is sending in underlying trade (3C charts, risk asset layout, macro fundamental data, etc.)


As for some key events this week from GS:


Monday July 9
  • China CPI (June): China CPI was 3.0%yoy in May. Consensus expects 2.3%
  • Draghi Speech at the European Parliament in Brussels
  • BOE Tucker Testimony to Commons
  • Eurogroup/Ecofin Meeting
Tuesday July 10
  • UK Industrial Production (May): Consensus at -2.1%yoy for May, down from -1.0%yoy for April.
  • Weidmann Speech in German Constitutional Court
Wednesday July 11
  • Japan Monetary Policy Meeting: Consensus expect no further easing steps from the MPC at this meeting.
  • Germany CPI (June): Consensus expects 1.7%yoy in June, unchanged from the print in May.
  • Brazil Monetary Policy Meeting: Consensus expects the SELIC to be cut by 50bps from 8.50% to 8.00%
  • United States Trade Balance (May): Consensus expects -$48.4bn in May, down from -$50.1%bn in April.
  • United States F_O_M_C Minutes
Thursday July 12
  • South Korea Central Bank Meeting: Consensus expects the base rate to remain unchanged at 3.25%.
  • Indonesia Central Bank Meeting: The policy rate was at 5.75% in June. Consensus expects no change in the July Meeting.
  • Chile Central Bank Meeting: Consensus expects the base rate to remain unchanged at 5.00%
  • Euro-area IP (May): Consensus expects 0.0%mom up from -1.1%mom in April.
  • ECB Monthly Bulletin
Friday July 13
  • China Real GDP (2Q): Consensus 7.7%yoy down from 8.1%yoy in the first quarter.
  • China IP (June): Consensus expects IP to be 9.8%yoy in June up from 9.6%yoy in May. 
  • Russia Central Bank Meeting: Consensus expects no change in the overnight auction based repo rate at 5.25%.
  • US PPI (June): Consensus estimates of -0.6%mom, up from -1.0%mom in May.


From Bloomberg, the US Calendar for this week...


Click for a larger view or you can find it at this link


Summarizing: I expect the main theme for the week to be a pullback/price weakness, although we may see some filling of Friday's gap early in the week. It jut seems the EUR/USD is too disconnected with the market, 3C seems to agree. We'll be watching for any changes and opportunities as always.


Have a great week ahead.

Friday, July 6, 2012

Nimble

I'm glad I closed those UVXY calls for a 1 day 23% gain, look what they'd be worth right now...

They are now below yesterday's close.

Here's the reason I closed them...

As mentioned in this post... I'm not a huge fan of short term trading, at least not this kind of short term trading, but as the charts in this post have shown, we have seen just about ZERO movement in the market over the last 4 months while volatility has doubled, this means short term trades are about twice as profitable as they were 4 months ago, but they need to be watched closely and closed out quickly when there are signals such as the signals seen in UVXY (linked above) and the market in general today.

There are longer term trending trades available. Of the core short positions we built and I have held, several are at gains of 10-20% with no options, no leverage. The long positions added for reasons I'm sure you are well aware of, were added at key areas as well and those positions are at gains of 10-20%, in fact, in the equities model portfolio there are 6 shorts and 4 longs, only 1 position is at a loss, 5% in one of the longs, but these trades I don't even look at, I haven't closed any since opening them, so it is possible to establish longer term trending positions and see good profits (gains of over 20% in a market that has moved about 0% since these positions were opened), just goes to show you it can be done, the key remains to be patient and let the trade come to you.

As you saw in today's sentiment update, one of the traders who is considered to be a good trader, was just knocked out of the game. This market is a meat grinder, but it's possible to make money in it (even when it hasn't moved in 4 months!). You need to know what you are comfortable with and wait for that nice pitch down the middle before you swing. I feel pretty good about having 10 long and short positions and numerous short term trades that have made good money in 1-3 days and I don't even have time to really make these trades, so you can certainly do it. In fact many of you are doing it by the emails I receive every day.

This is the difference between having an edge and treating trading like a business and wondering around the market from 1 system to another, wildly swinging at any price movement.

I'll have updates over the weekend and maybe a few more tonight. I hope you all have a great, relaxing weekend!


SLV/GLD

With the 5 min negative in the Dollar and the 5 min positive in the Euro, the market activity makes sense, so would a similar move in GLD and SLV, perhaps again, a gap fill.

Longer term there's some constructive action in both, but I don't feel comfortable trading wither from the long side yet, although when the time comes, it may be a very profitable trending trade, we'll just have to see if the slow improvement of the longer term trends continue. For now, the short term, like the market...

 GLD 5 min-below SLV 5 min


AAPL Update

There are several different timeframes in play here so I'm going to do my best to describe them and obviously depending on your outlook, timeframe, trading style, there are several possibilities.

 AAPL, like the market, has been choppy as well. The ascending triangle that formed was really in the wrong place for that type of price formation, but the failed breakout at the yellow arrow probably would have emboldened the shorts. The daily chart earlier looked like a Harami downside reversal, but right now we are seeing the start of the move up I have described today on the short term intraday charts with positive divergences, if traders entered AAPL today on the short side based on the Harami reversal, they may be covering shorts right now, although it isn't a huge pattern, AAPL is closely watched.

 The 60 min chart went positive in mid May and has moved up since then, but now the 60 min chart is a bit negative, indicating that a pullback would probably be the logical next significant price move, which is in line with our market expectations.

 The 4 hour chart is leading positive, so just as I believe we will see a pullback in the market and then a resumption of the move up in to a real short squeeze, AAPL is displaying the same potential on this long and important timeframe.

 The shorter 15 min chart has a negative divergence suggesting the same pullback I envision for the market in the near term.

 The 5 min chart for the most part agrees.

 On an intraday basis, the 2 min chart has been in a leading positive position since 12 p.m., similar to the intraday positive divergences I have described in the market, perhaps they try to fill today's downside gap, perhaps its less ambitious than that.

The 1 min intraday chart was in line with price action and is now leading positive a bit, so as I mentioned, we may see some gap filling Monday or even some upside action in to the close, this appears to be confirming that upside in to the close.

So to put it all in order, we have a near term (through the close, perhaps Monday) divergence that suggests some gap filling from today's move down or some backing and filling. The pullback in the market still looks like the most probable outcome, there are several charts suggesting this could be a sharp pullback, it may even be enough to create some new lows in several key stocks and bring the bears back in to the market. AFter that pullback is complete, I believe we have the signals on the right timeframe to resume a move up and finally effect a real short squeeze. Should we get that short squeeze we'll be looking for distribution in to the move up and looking to add or establish primary trend short positions, by that time, as far as I can see now, we should start to resume the primary move to the downside.


Gap Fill Monday? Closing USO Aug. $33 Put from yesterday

Or maybe some action in to the close...

The USO position from yesterday...

There's a nice 1 day 30+% gain, here's why I'm closing it as I don't have a lot of patience for pullbacks or corrections in options...


 The SPY 5 min chart I showed earlier thinking we'd get some intraday lift is still putting in an intraday positive divergence, this suggests some gap filling to the upside, perhaps Monday, maybe in to the close?

 On the same timeframe the $USD has an intraday negative suggesting it pullback, which would hurt the USO Put.

 On the same timeframe, the Euro is confirming the above charts with an intraday positive divergence.

Now, I still haven't changed my mind about a larger pullback, this is an example of why...

SPY 15 min leading negative divergence.

So it looks like in the very near term we'll see more of that chop on a short lasting move up, longer term charts still say pullback, but why give up a 1 day 30+% gain?

Sentiment and the right tool for the trade...

Today's sentiment report from the Twitter-verse...

Hi Brandt,

This is from one of the better traders:  my heart broken simply because my last day trade short position was stopped out with nothing. Now I hold nothing, so pretty much out of the game."

I thought I might give you a little volatility update, this is why some of the better traders out there are going bust, they aren't listening or don't have the tools to listen to the message of the market.

 Over the last 2 months nearly to the day, the SPY has lost exactly 0.23%, in other words, while volatility has increased, the market has gone virtually nowhere.

This is a representation of 10 day (2 trading weeks) average volatility or more similar to ATR, Average True Range. We went from about $1.01 a day on average to $2.21 a day on average over the last 4 months. The market movement from the left side of the chart to today, +0.31%

This is what I mean when I say "The Market will never make it easy". I think we've done pretty well, but this is an absolute washing machine or blender, just knocking traders out of the game, a ZERO SUM GAME.

UVXY Calls follow up

 UVXY July 8 calls from yesterday, I'm not seeing much upward momentum and would rather not give up this gift.

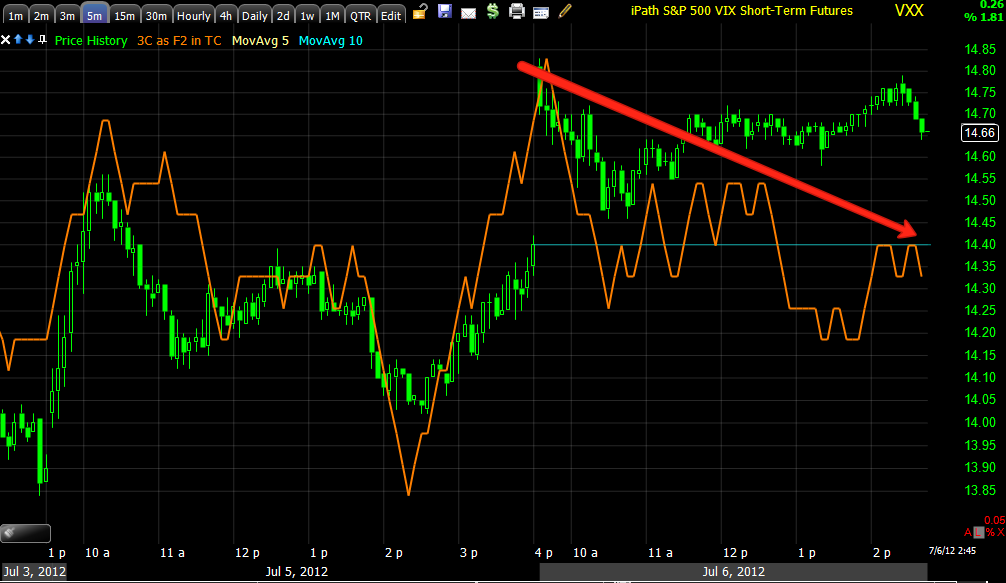
 2 min intraday negative divergence has me a bit cautious about a little gap filling in the market averages or some consolidation, neither of which will help this position in the near term. These are July Calls, if I had August I might wait them out.

 The 5 min-this is just the intraday divergence, the longer term chart looks fine.

Ultimately the VXX/UVXY ETFs should have quite a bit more upside in them, just on a short term basis and with July calls, I'd rather take that quick profit.

Closing UVXY Calls

You may wish to keep them open, I'm just thinking about a possible gap fill and I'm not all that comfortable personally in these volatility ETFs.

I'd rather look for a place to re-enter and keep the 23% 1 day profit.