Tuesday, September 4, 2012

Here's another bothersome chart-TLT

TLT trades nearly exactly opposite the market, it is a long term 20+ year Treasury ETF, it is what you call a "Flight to safety trade" when the market looks to be in trouble, why is it not dropping like a rock?

There's even a positive divergence late in the day that I didn't expect to see today, price alone should be near vertical to the downside with the market move.

This is what bothers me, it looks like a last minute flush of risk assets in to very quick demand, no one has any idea why, it APPEALS to greed. If in fact the move is toward risk on, why aren't they aggressively re-positioning out of TLT?

This feels like exactly what I just said, an impulsive move to create impulsive buying by appealing STRONGLY to our greed instinct.

BIDU

Is BIDU a dud? There are a lot of parabolic charts out there, there's no currency arbitrage to make such a move, I haven't heard any rumors, it looks like a program just kicked in, but why is BIDU not making a parabolic move? I'm not crazy about the way this chart looks, but I'd try to be as patient and rational as you can and let price tell you if it is done or is just got a wet fuse.
Where's the parabolic move?

A break below the range wouldn't be a very good sign for BIDU

AAPL

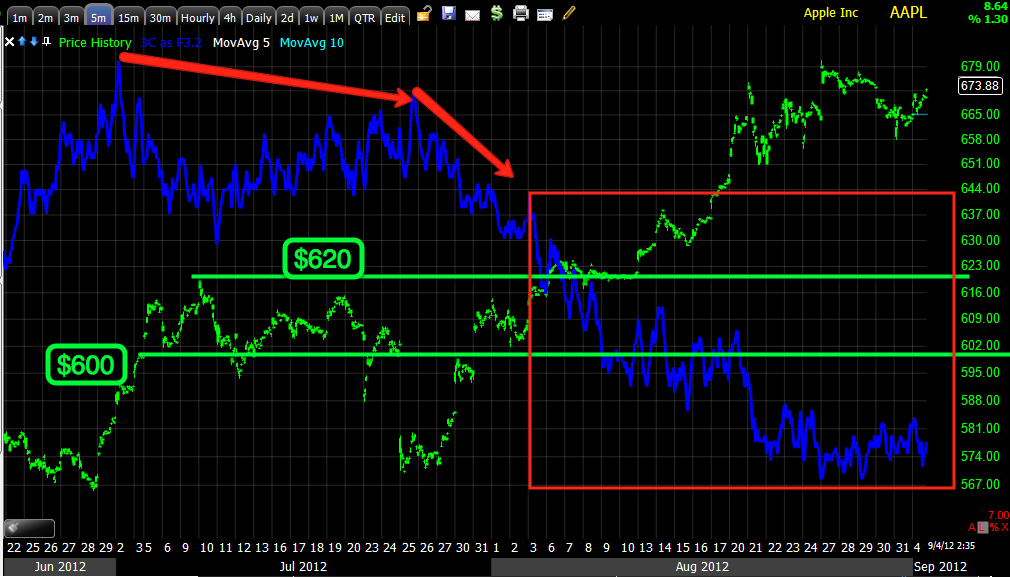
First I think we have to acknowledge the very parabolic price move, while these look impressive and very bullish, they almost always end badly, I never trust them either up or down, this isn't specific to AAPL.

I'm not sure what's moving this either, I haven't seen rumors, it's not currency based, like I mentioned, the first day of the month could see some very aggressive movement to the downside.

 My target to enter the rest of a put position in AAPL is around the $680 level, I'll be re-evaluating that with this parabolic move apparently out of thin air.

 I was going to point out that although AAPL didn't look as bad as BIDU's intraday charts, if you roll them back to 2 pm there were slight negative leading divergences, again not as bad as BIDU and there was that flat range.


 This is what the 1 min in AAPL looks like currently, it is in line with price.

 The 2 min at 2 pm, no where near BIDU, but still a minor divergence and flat area.

 2 min now is in line

 3 min is in line

 5 min is lagging, I think it is because of the speed of the move and not a negative divergence.

 The 5 min again at key price levels and the deterioration, this gives me the confidence to enter the other half of the put AT THE RIGHT TIME AND PRICE LEVEL.

The 10 min chart is a little better than in line, but this isn't a huge deal. It will be very important to watch the parabolic move for signs of failure. I'm hoping it will hit $680, if not, we'll see what everything looks like.


AAPL Update next-

AAPL may help with BIDU perspective.

BIDU Update

If you are long BIDU on calls for a short term trade, this is a tough call. If you are short via equities like the core BIDU short this is an easy call, if you are looking for a put position (we closed out the last put position opened on 8/16 for a great profit and have been waiting for another set up), then it's just about letting the trade come to you and see if it does or not.

Here's how we look. Keep in mind, we are now out of the month of August so monthly window dressing is and has been a done deal, we still have Q3 at the end of September and I think for the funds that allow it mid year, the redemptions will be coming in.

 In and/or above this yellow area is where I'd consider a new put position, the reason is it creates a higher high and some retail will buy that. If we don't get there, it's hard for me to justify a put that isn't giving me a reduced risk position and higher probabilities on a head fake move, I'd rather just hold the core short and look for other opportunities.

 Short term if you have a call, I don't like the looks of intraday trade, it's very flat (often where accumulation and in this case, distribution occur-REMERMBER THAT, they are most active when you least expect it). We are leading negative on a few intraday timeframes.

 2 min

 5 min

 The 10 min "looks" like there's enough juice to take BIDU higher, the things we have to consider include fund positioning, how the divergences are moving, etc.

 The 15 min is in line, the positive divergence never made it here so the move was capped, I never expected a huge move from BIDU.

Hourly, this is where I think the top of the counter trend bear rally was.

The real question is whether the intraday timeframes are seeing distribution and they try to push BIDU higher to distribute more, it may not happen today OR whether the natural progression of a divergence is taking place as the short timeframes turn first and they work their way to the longer ones like the 10 min that is still positive and the 15 min that is still in line. This makes BIDU very difficult from a long perspective right now, if this weren't the first day of a new month I'd lean toward holding BIDU, but being the first day of a new month, positioning in Hedge funds may turn aggressively negative. I'll keep watching for signs and post them.

"IF" I had any profit in BIDU long, I'd consider taking some off the table and lowering my risk, waiting for a better set up that is more in line with the bearish nature of the stock.

Closing September AAPL $675 Calls

At a 12+% loss on the position.


This would not be a normal position size, but because I entered the order several times when it wouldn't fill it eventually did fill all of the orders.


Pieces are coming together

The one question that had been bothering me with all other evidence stacked up in a bearish direction was credit. While ETFs representing underlying credit do have a T+3 settlement rule, that rule is for securities/equities/stocks, so HYG for example would be bound by the "Trade Plus 3 Days" settlement rule, however it is tracking real credit, I have not seen any SEC regulations that Credit transactions are bound by the T+3 settlement rule for equities.

The first bit of evidence that HYG and other High Yield Credit wasn't as strong as price appeared was in the form of 3C charts. Last night I gave you further evidence collected that Hedge Funds are moving out of "Risk On" positions which is exactly what High Yield Credit is as opposed to Investment Grade (IG).

The only reason that the T+3 rule even comes in to the equation is because of what happened in credit today and today's date, Friday was the last day of the month, important for fund performance and window dressing, but apparently there appear to be different standards for settlement in Credit vs Stocks as evidenced by the price action in High Yield Credit on the first trading day of the new month.

So lets take a look at the Risk Asset Layout now.

First the evidence that has been very clear.
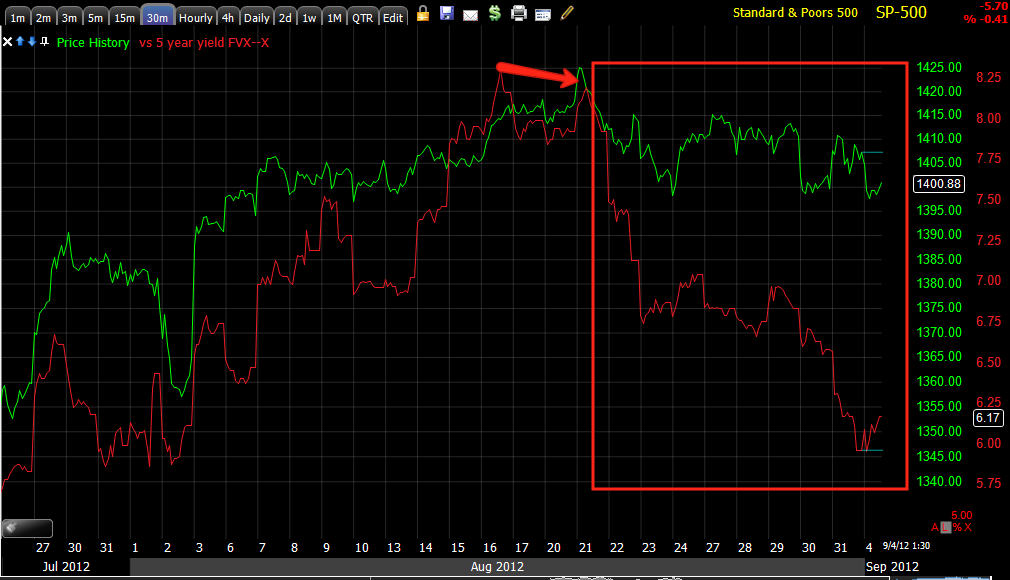
 Yields haven't failed us yet, the SPX (green) tends to follow yields like a magnet once they diverge like this.

 A reversal and timing is one thing, the amplitude or seriousness of it is another, look at Yields compared to the former highs in the SPX, this speaks to the seriousness of the situation, not just timing of a reversal.

 The $AUD intraday isn't interested at all in following the SPX.

 Longer term it is another that hasn't failed us when it gives a signal thus far and the signal just got a whole lot worse.

 Take a look at the last market reversal and $AUD divergence and this one, again you get that feeling of a bear market counter trend rally rather than what the price trend really represents, but price is deceptive.

 Commodities had also recently been moving on a legacy arbitrage basis, I'm not sure about their settlement schedule either, they are not equities, today they are very much out of sync with the SPX.

 Here you can see them following the EUR/uSD legacy arbitrage model, that seems to be breaking down as I believe the Euro will as well shortly with record low short interest for the year.

 High Yield Credit is falling with the SPX, not a very liquid market so not my favorite, but it's a start.

 High Yield Corp. is underperforming the SPX worse than the chart shows, this is a very liquid market.

 Here's a better view of High Yield Corporate vs the SPX, finally diverging, but why so long?

 We have seen HY Corp. Credit pull a head fake move out of a 3 month downtrend channel, after it popped above the channel, it fell fast, this appears to be a larger head fake move as you saw in last night's post, hedge funds have been moving out the last month, remember what we see preceding 80% or more of reversals, it's right there in yellow and the fact HYG breaks down after the month of August closes is interesting as well.

 Remember I checked out the internals of HYG as it didn't make sense? Here's the divergence on the 4 hour chart at almost the exact same relative price level, much less flow in HYG now.

And closer, the 5 min chart breaking down badly as HYG made that slight new breakout high Friday that failed today.

 Junk Credit isn't any better than HY Corp. Credit. These were the missing pieces, but apparently the evidence for them staging a false move is there.

Sector rotation today doesn't look good.
Only financials are making any showing, Tech is trying, but Energy, the high momentum/Beta Materials stocks are down and out, Energy, Discretionary and Industrials look horrible and all the defensive sectors are stronger than ever and you saw how strong they were last night longer term.

Market Update

There's already some evidence building that the intraday bounce called late this morning is starting to lose traction. I'll update those charts, but I wanted to get the message out ASAP, there's also some loss of traction in AAPL's intraday move, I'll update that also.

And there goes that intraday move

About an hour an 15 mins. ago I warned you or gave you a heads up if you wanted to trade it, that the market would see an intraday move higher, 3C on the NASDAQ futures, QQQ and a few other averages. Since then several others have built in, I still see it as a volatility move, there's not much supporting it.

Case in point...
 This is one of the charts showing the intraday move up...

The QQQ at the time of the post...
This is the time of the post...

The NASDAQ Futures 5 min 3C chart as shown this morning with a really bad leading negative divergence. This is what I mean when I say there's no support for this move beyond the 1 min chart, an intraday timeframe.

UNG Update

UNG is likely going to see a pullback which is fine, it's about that time as I'd rather see a healthy pullback than it get too overbought and gappy.

This will likely provide an opportunity for those still building positions or considering UNG as a long term long position. We'll double check the underlying trade in any pullback to make sure everything is as we'd like to see, I don't have any concerns though at this time.


 There's a gap today, there's resistance and gap resistance just overhead and base neckline resistance just above that, that's a lot of resistance areas and it would be nice to see UNG pullback and gather some strength before attempting to break through all of those levels especially after it has already moved through 1 level on the current leg and is 4 days in to this move.

 The 1 min chart is still confirming the trend which is good to see...

 The 2 min chart has been confirming very well, but is showing some signs of a pullback.

Ultimately it already looks like UNG has already made preparations for a move through all of the overhead congestion as the 15 min chart is leading positive between the two same relative price levels, further strengthening is like a coil or spring, it should just give UNG more momentum.

As for timing and catalysts, we still have the EIA Natural Gas report Thursday despite yesterday's holiday, so maybe a 2 day pullback or so in to the report? It wasn't that long ago that UNG surged 14% in a single day on an EIA report.