Thursday, September 27, 2012

Bounce is on its way

If you picked up some long assets for this bounce, even the URTY (IWM 2x long) this morning, you should be feeling pretty good right now.

I'm not sure what the catalyst is behind this recent move...

 ES

EUR/USD

The move started around 11:55 am EDT, it would seem connected to the Spanish news:


  • SAENZ SAYS SPAIN PLANS 43 NEW LAWS TO BOLSTER ECONOMY
  • SAENZ SAYS REFORM PLAN IS TO MEET PLEDGES TO EU PARTNERS
However that news was out at least 30 minutes earlier.

In any case, bounce longs like URTY or ERX are doing well. I'm going to browse some charts and see if there are any surprises coming

USO / ERX Update

Yesterday's posts on USO  and USO/ERX Long both showed the charts and evidence for a move up in USO and more broadly energy. USO is up 1.44% today and ERX +2.53%. Lets take a look and see how the move is progressing for both.

 Light Sweet Crude futures 1 min seem to be in a consolidation or in line with price, all in all this is good for the move in oil.

 The 15 min chart shows the same positive divergence that USO has shown and the reason why I've expected a pop higher, I'm not so sure this is a corrective move.

 At 30 mins the move seems to be capped as it is no better than in line on a downtrend.

USO
 The bullish/bearish candlestick with volume has worked well and it's a concept worth putting in your tool box. At the red arrows we have a bearish reversal candle with high volume, it worked out, at the green arrows we have a bullish reversal candle on high volume and it worked out, the high volume at the yellow arrows is insignificant as there was no bullish/bearish REVERSAL candle there.

 I'm certainly interested what oil can do, the 4 hour and even 60 min charts don't look good for the bigger picture, but I'd rather follow the message of the market for now before just accepting these signals on long term charts, although they are quite impressive.

 USO's near term intraday leading positive divergence yesterday along with the general tone of the market made it look probable that the move up would start today.

 As for initial targets, I'd think at least a higher high in the new downtrend and perhaps even a new high.

ERX
 ERX formed a bullish pennant today, I show signals that suggest it breaks higher, but as I'm writing this, it already broke higher, now up +3.84%.

 ERX 4 hour chart like USO doesn't look good for the big picture.

 Like USO, the leading intraday positive from yesterday made it look like ERX was ready to make its move today.

 This is the positive divergence intraday on the pennant consolidation, but as mentioned, it already broke higher.

Here are the initial likely targets for ERX, again a higher high in the newly forming downtrend or even a new high.

We'll be watching for the next trade in both, I hope you were able to grab some.

PCLN Trade Set up

PCLN is a current core short position from late April and even with a counter trend bounce of almost 2 months, it's still up 18% with no leverage. There's a little room to add to the position and this is what I'm looking for to add to PCLN, it's pretty simple and if we get the market bounce we look set for, it should be pretty soon.

 The daily chart shows the PCLN short entry at $761.79 on a head fake breakout from a bullish wedge, we already knew there was 3C distribution before the breakout even started so the head fake move was a high probability/low risk entry. PCLN fell over 17% on August 8th on heavy volume and has been trying to retrace that gap since. The channel is what is important here.

As you can see we have a little more upside before the gap is filled. We haven't seen too many channel buster since earlier this year, but PCLN just busted the channel to the downside, most traders would be looking to short that break, but more often than not, these channel breaks reverse and a reversal to the upside (with a market bounce) could put PCLN in to the gap and ABOVE the channel, that's the channel buster I want to look at shorting/adding to PCLN, somewhere in the $662-$672 area. By that time the negative divergences should also be present, this could be a matter of a few days so I'd set price alerts if you are interested in the trade. This would certainly be a set up in which the trade comes to you with a better entry and lower risk.

URTY Position

As a matter of fact, I think I will open a long position in the equity model portfolio using URTY, it seems to be a well suited tool for this kind of move.

If you are going to play the bounce...

Now's probably the last chance you'll get to do it while several of the averages are still close to potential stops with low risk.

 The QQQ is already following this morning's leading positive divergence higher.

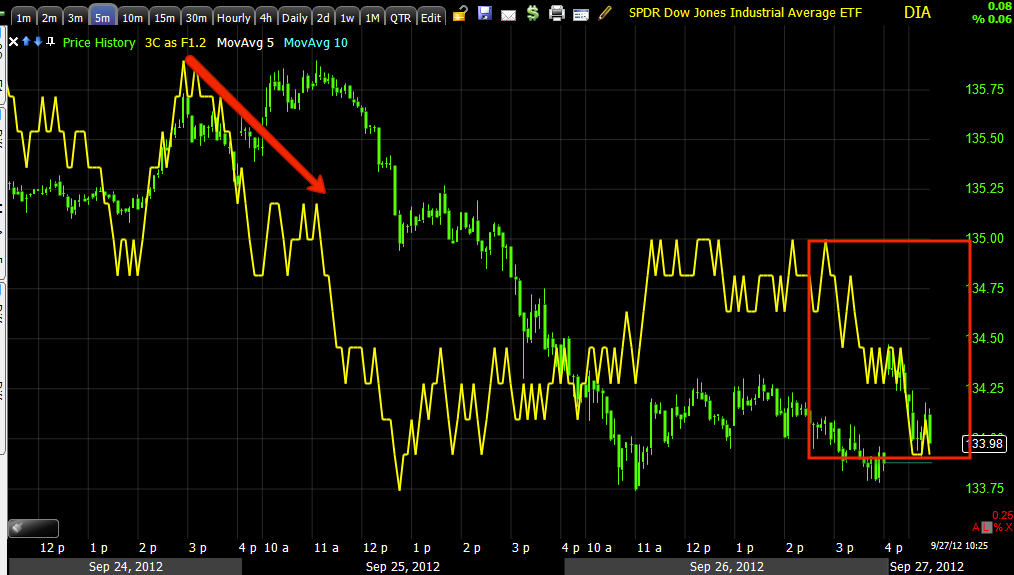
 Meanwhile the DIA is just starting to shape up, I still think it will bounce with the rest of the market, but relative performance will be of great interest a will be divergences between the averages.

 DIA 10 min, while not extremely impressive, still has enough to bounce on an oversold correction.

 The SPY is still not doing much on the 1 min

 but like the DIA, there's enough built on the 10 min to see it bounce.

 The characteristics of the bounce look to me to be a volatile or sharp, but rather short lived move as the base or accumulation area is quite small, but as I said yesterday, Wall Street rarely makes a move without it accomplishing some goal and that is usually to turn emotions, cause confusion or doubts. This 15 min chart shows the limitations of the move, it's not the larger accumulation I was on the look out for as prices moved lower suggesting smart money was bringing prices down to accumulate a large post QE3 position.

 The IWM 10 min looks good, if I were to play an average for a bounce right now, it would probably be the Russell 2000 given the divergence and that it is still close to the base.

The 30 min chart again shows the limitations of the move.

AMD Closer

AMD is up 4% and above resistance, it needs to hold on a close obviously, but it's looking better.

 Daily

 5 min chart

5 min

Opening Indications

As I have suspected, the market is split or what I have been calling bifurcated. While the pullback this morning was put to good use by the QQQ and the IWM to a lesser extent, the SPY has remained pretty much in line, not seeing the same early strength as the QQQ and IWM and the DIA downright looks bad thus far.

 DIA 1 min negative on the open.

 DIA 5 min also moving from negative to in line with price.

 IWM 1 min adding to the positive on the pullback from the open

 Same with the IWM 5 min

 QQQ 1 min is leading strongly to the upside.

 As is the 2 min and several other timeframes.


 SPY  1 min is simply in line with price

And the 2 min hasn't gained or lost anything, again in line.

I suspected this kind of dislocation on a larger basis, but not on a simple bounce.

AMD Challenging the Head Fake level

AMD is up about +2.4% and close to breaking above resistance which would confirm the recent break below support was a head fake move and likely give AMD some upside momentum.

 AMD daily chart, it just needs to move above the red trendline.

 Intraday this morning.

The probabilities look good for AMD as this 15 min chart is positive, especially at the area in which it broke below support (likely head fake move).

And it starts

There's the downside I just mentioned starting...
3C has been negative since the European open and a bit more so since the US open. There seems to be some support close by though.

ES

After a night and morning of bad news/good news from China to the US, ES looks a little susceptible here to some minor downside early on, I doubt it would be anything extreme and I doubt it would hold very long.