Tuesday, October 2, 2012

TJX Trade Idea

This looks like a longer term trade idea in a stock that looks to be a prime example of a company that benefitted from the QE-driven, "Rising tide lifts all boats". My guess is this is a stock that is not worth its current valuation and although the longs had a nice run, it seems they are long ago headed for the doors.  I'd suspect this to be more of a longer term trending position with good probabilities and even at these levels, I don't see the risk as significant at all.

 To the right we see what looks like real organic growth as volume rises with price, since 2009 (the QE era) growth has been a lot more extreme, but volume has been very ugly, so once again, this seems to be a QE-inflated bubble.

 The 3 day Trend Channel held the uptrend off the October 2011 market lows, it just recently broke the Trend Channel showing a change of character in price action, once the Trend Channel is broken, I feel pretty good about a position.

 The 60 min chart seems to show a very long leading negative divergence, but the it's only about 3.5 months or so, compared to an uptrend since at least October 2011 and we could go even further back, the negative divergence seems to be about the right size for the preceding trend.

 More recently the 15 min chart shows a negative divergence at 3 pops above resistance, each failed before a break below local support on a leading negative divergence.

 Here's the close up of the 15 min, with what looks like a head fake upside move that failed  in to a leading negative divergence, all in all, this doesn't look like a bad place to consider a position, maybe you can get a little better positioning, but I'd feel fine entering here.

The 1 min chart has a small relative positive divergence so "maybe" this sees a move a bit higher, maybe yesterday's close, but in the larger scheme of things, I don't think it matters all that much.


UNG Crosses a new threshold

For members who have been around a while, you probably remember when UNG was still trending down in price and we started paying attention to it, then it started moving sideways, there was a lot of volatility as there typically is in a base-like formation, but I viewed and still view UNG as a longer term, maybe even investment (never thought I'd say that) position.

Today UNG crosses a new threshold which seems to indicate to me that UNG has been under recent accumulation even up in this area (toward the top of the base).

This is a 4 hour (longest timeframe we look at before daily charts) leading positive divergence. This appears to have started leading yesterday afternoon.


FB Pullback

FB looks set to pullback from this area, it has an open gap around $19.70-$19.75.

 FB 10 min

 FB 15 min

FB 30 min

Market Update

While there aren't a lot of consistent intraday signals (this is something that has been the norm since QE3 was announced), ES does have a positive 1 min divergence, among the Risk asset layout indicators, most are in line with the SPX except the Euro is higher, so I think that would also support an intraday move higher.

Don't forget about GOOG

GOOG is another we spotted last week looking weak in underlying trade, it then formed a triangle which looked like it would see a breakout move from and likely a head fake breakout, it has continued to deteriorate on the 3C charts.

While I'd normally expect these to spend more time at the breakout levels, many of the stocks that are in this same position like IBM, don't look like they want to hang around those levels very long.

GOOG updated charts...
 GOOG was already showing negative divergences on the 24th, so when this triangle formed, I suspected it would make a breakout, but it likely wouldn't hold or see follow through. I'm still a bit cautious about rushing in to larger positions and would rather phase in to positions, but thus far these seem to be deteriorating faster than normal.

 The 60 min GOOG chart was just starting to show a little weakness and it's now at a relative negative divergence, last week it was still in line.

 Last week the 30 min chart was in line, it's now showing a leading negative divergence where it has traded with price for months.

 The 15 min chart

 The 5 min chart.

Ultimately the 1 day Trend Channel holds the entire trend from July, so a close below the Channel around $731 presently, would be a significant event for GOOG.

Also note recently in the red box all of the candles with either long upper wicks and/or small bodies, just about everyone of them looks like GOOG has lost all momentum and those are not good candlesticks to see in a trend like GOOG has been in.

IBM Again

Time to start adding to the IBM short? It seems like time is moving pretty fast for IBM, I don't like to rush in to positions, but as mentioned, events seem to be unfolding pretty quick.

 IBM on a daily chart was set up perfectly for a head fake move, a big bullish flag, a break above resistance, all of those things that longs like to see and all of those things that create head fake moves or bull traps. We've been watching IBM to do just that and thus far it has done just that.

 The last update this morning as IBM was headed down I said I thought it might linger around resistance which is now at yesterday's close, it moved up that way and headed lower.

 With the timeframes all looking pretty bad like the following: 30 min

 15 min

 5 min

 3 min

It's starting to look like IBM may make a quick head fake move and not the longer lasting moves that linger above support for days or weeks. So that means I'd probably look at adding to yesterday's IBM short that was started.

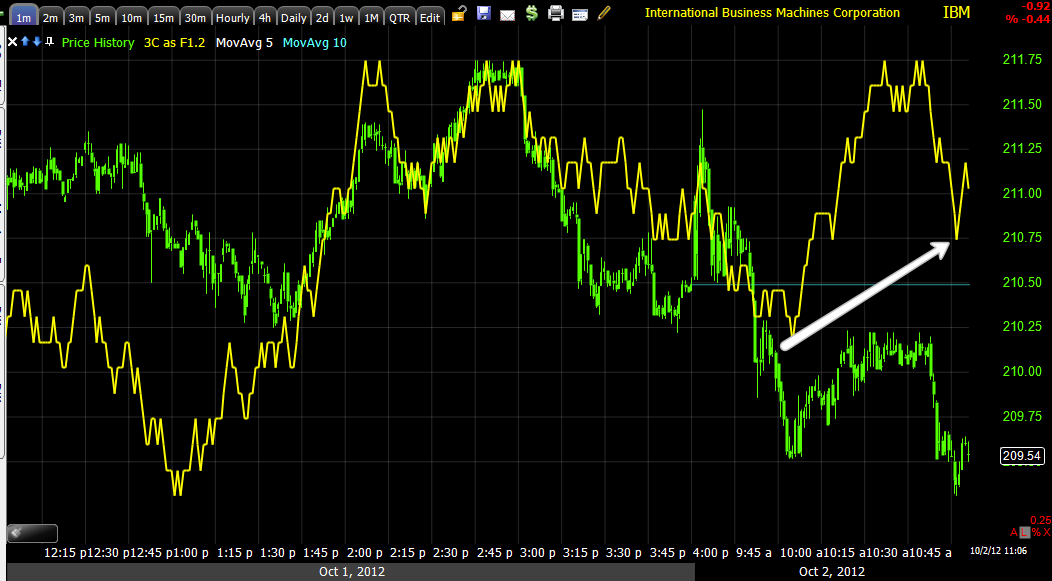
 At best there's a 1 min intraday positive divergence suggesting an upside move from here, how far? I wouldn't say too far as of what we see right now.

The 2 min chart is possibly positive, it hasn't turned upward yet and the 3 min is negative, so as of now, it doesn't look like much of a move up, but it is early in the day and there's time for the intraday charts to improve, but I'd probably consider adding another 25% on a move higher, around yesterday's close would be nice, above it would be better.

BIDU Trade Update

Yesterday in the BIDU update I said I'd like to see BIDU travel laterally for a little while longer to build an area of positive underlying trade in which it can rally from. So far this morning it's not about the gap down and the move back up, it's about the sideways movement as it treads water and the charts improve as I thought and hoped they would.

 This 10 min chart shows today's action thus far contributing to that lateral, "U" shaped consolidation that I wanted to see.

 This hourly chart shows you where our price formation is now and a few recent similar price formations I'd like to see this one look like.

Already there's improvement in the BIDU charts.
 5 min is leading positive today

 10 min is also leading positive today, if it keeps adding to this it should be a very nice looking long.

Even the 15 min went positive at the open and is adding a leading positive divergence. This is why BIDU needs some time to consolidate, to let these divergences build, in the end it will make for much better probabilities.

ERX Update

Some of us have ERX long (Energy Bull 3X), I'm looking at the charts and think that a profit can be made on a bounce, but longer term I'm not loving what I'm seeing. I'll be setting several price target alerts and take a look at ERX at each, but I suspect at one of them I'll likely be looking to close the position.


 I don't really care too much for that upside break of the channel, "Channel Buster", the bullish looking breaks usually turn out the opposite and vice versa, but I do think a bounce from this area is still likely so I'll try to wait on that before deciding where to close ERX out.

 The 5 min chart from the negative divergence at the upside channel break and a positive divergence at the lower channel.

 15 min chart with positive divergences at the lower channel boundary.

 It's this 60 min chart, which fits well with this weekend's post about the Commitment of Traders and the 3C analysis that fit well with the Commercial COT. The fact this shows up here where the Channel break to the upside occurred also is part of my reasoning as it hasn't done much since but deteriorate more.

Here are several general areas in the channel that are either gaps or resistance areas that i'll be looking to unload ERX, depending on how it looks at each level, obviously I want to close it as high as possible.

IBM

IBM has seen negative migration through almost all timeframes, at least to 30 min on this recent little spike up. There's not a lot of intraday information yet on the 1-2 min charts, but I assume that it will linger around yesterday's close for a bit as it that is the first new resistance area.

I may look to add to the position later today.

Bad News is Good News Again

Overnight the Australian Central Bank, RBA (Royal bank of Australia) cut their policy rate from 3.5% to 3.25% on the notion of a weaker near term outlook for China, this easing sent futures higher overnight as you can see below on the ES chart.


So far on the opening indications, it's a mixed bag, but definitely leaning toward more averages not confirming the opening gap on the 1 and 2 min timeframes.