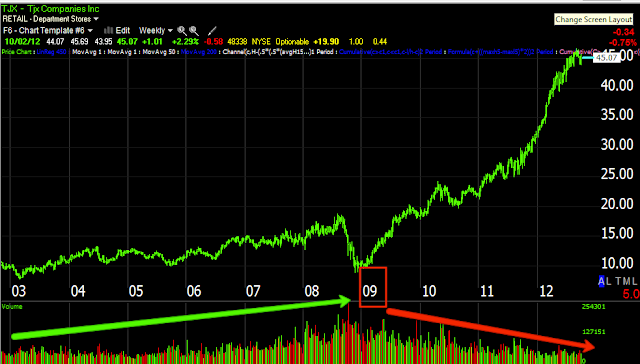
This looks like a longer term trade idea in a stock that looks to be a prime example of a company that benefitted from the QE-driven, "Rising tide lifts all boats". My guess is this is a stock that is not worth its current valuation and although the longs had a nice run, it seems they are long ago headed for the doors. I'd suspect this to be more of a longer term trending position with good probabilities and even at these levels, I don't see the risk as significant at all.
To the right we see what looks like real organic growth as volume rises with price, since 2009 (the QE era) growth has been a lot more extreme, but volume has been very ugly, so once again, this seems to be a QE-inflated bubble.
The 3 day Trend Channel held the uptrend off the October 2011 market lows, it just recently broke the Trend Channel showing a change of character in price action, once the Trend Channel is broken, I feel pretty good about a position.
The 60 min chart seems to show a very long leading negative divergence, but the it's only about 3.5 months or so, compared to an uptrend since at least October 2011 and we could go even further back, the negative divergence seems to be about the right size for the preceding trend.
More recently the 15 min chart shows a negative divergence at 3 pops above resistance, each failed before a break below local support on a leading negative divergence.
Here's the close up of the 15 min, with what looks like a head fake upside move that failed in to a leading negative divergence, all in all, this doesn't look like a bad place to consider a position, maybe you can get a little better positioning, but I'd feel fine entering here.
The 1 min chart has a small relative positive divergence so "maybe" this sees a move a bit higher, maybe yesterday's close, but in the larger scheme of things, I don't think it matters all that much.
Is interest rates about to start going up?
-
Yes, I know - it does not make any sense - FED is about to cut
rates...but....real world interest rates are not always what FED wants it
to be.
6 years ago


No comments:
Post a Comment