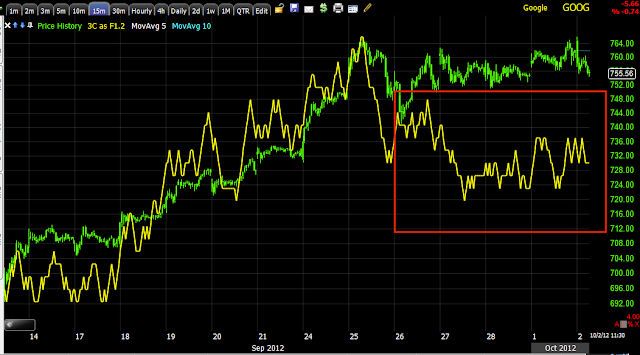
GOOG is another we spotted last week looking weak in underlying trade, it then formed a triangle which looked like it would see a breakout move from and likely a head fake breakout, it has continued to deteriorate on the 3C charts.
While I'd normally expect these to spend more time at the breakout levels, many of the stocks that are in this same position like IBM, don't look like they want to hang around those levels very long.
GOOG updated charts...
GOOG was already showing negative divergences on the 24th, so when this triangle formed, I suspected it would make a breakout, but it likely wouldn't hold or see follow through. I'm still a bit cautious about rushing in to larger positions and would rather phase in to positions, but thus far these seem to be deteriorating faster than normal.
The 60 min GOOG chart was just starting to show a little weakness and it's now at a relative negative divergence, last week it was still in line.
Last week the 30 min chart was in line, it's now showing a leading negative divergence where it has traded with price for months.
The 15 min chart
The 5 min chart.
Ultimately the 1 day Trend Channel holds the entire trend from July, so a close below the Channel around $731 presently, would be a significant event for GOOG.
Also note recently in the red box all of the candles with either long upper wicks and/or small bodies, just about everyone of them looks like GOOG has lost all momentum and those are not good candlesticks to see in a trend like GOOG has been in.
Is interest rates about to start going up?
-
Yes, I know - it does not make any sense - FED is about to cut
rates...but....real world interest rates are not always what FED wants it
to be.
6 years ago


No comments:
Post a Comment