Monday, October 15, 2012

Market Update-Big Improvements

Although we should be consolidating/pulling back for a while this afternoon (we still may close strong), the underlying trade is just blowing away my expectations with improvements that are huge considering the chart length and how long the market has been open today, I do think that gap fill this morning was a lot more than just that, in other words I think institutional money was very busy on that gap fill .

SPY 15 min
 The SPY is coming up to first resistance, it's a break through second resistance at the white arrow /upper trendline that will get shorts nervous being that's where the SPY failed from. There is some chance we get some symmetry similar to the AAPL H&S which wasn't perfect, but this does look a bit like an inverse H&S bottom with a left shoulder, hear and the upswing of the right shoulder which would still need a pullback and another swing up through upper resistance to complete, that's just a possibility, not a probability, but we need to consider all situations as we can make plans and no what we want to do if X, Y or Z happens.

We could also have...
 A large head fake descending triangle, this tells technical traders to expect more downside and they would have actually already shorted the price pattern on the break below support last week.

Volume isn't perfect, but a wedge of this size is entirely possible without having the drawbacks of acting like a wedge, in other words, it would be organic rather than engineered.

DIA
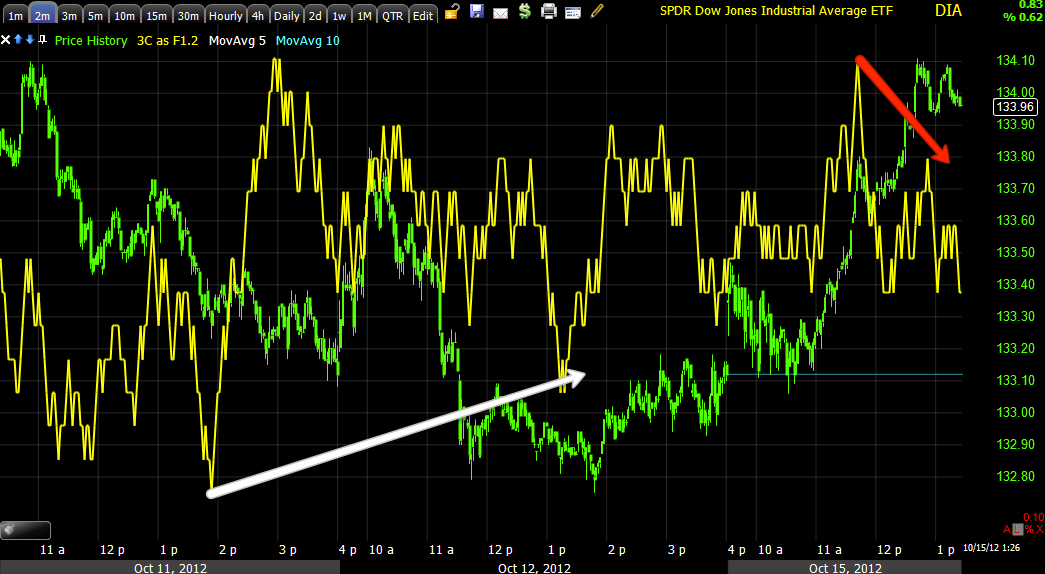
DIA intraday looks ready for a pullback/consolidation, but in context, it's really a minor signal.

Most of the new highs in the 15 min leading positive divergence were added TODAY ALONE!!! Everything in the box was today alone and the DIA had been the ugliest of all the averages.

QQQ
QQQ 1 min negative divergence/ intraday pullback, but....

Again, the 30 min in this case saw a lot of upside in the leading positive added today alone.

SPY
SPY 2 min intraday looks ready for a pullback after good confirmation today.

However once again, the 15 min chart which is a serious timeframe is seeing a new leading positive high above the highs of more than a week ago and all of that in the right, white box was added today alone. We don't often se such large 3C moves on such long timeframes in so little time/space, this typically means institutional activity has picked up big time.

Pullback/Consolidation Coming

An intraday pullback/consolidation should start any time now, we are in the range for it.

SPY Update

The S&P / SPY is doing well this morning and early afternoon, I would warn not to expect a straight line move higher, although as shorts are squeezed you will see more moves like that, right now it's still early in the day at 12:35 and I'd expect some more volatility and chop and we should see a strong close. 

The group that has the most representation in the S&P around 22%, Financials, are doing well so far, actually outperforming the S&P a bit and moving in to that triangle they broke below Friday which is the first step of locking in the head fake move. Since we've taken a good look at the NASDAQ, I figured why not the SPY considering all the weight in Financials.


 This is actually a very nice bear trap set up, the SPY looks like it's making a move higher that fails and breaks support, that gives shorts extra confidence to enter the SPY short, now the SPY is back above that level in which many would have shorted and we know this from other evidence like the StockTwits stream Friday where everyone was turning bearish.

You'll see this set up in 3C as it happened, it's hard to believe its natural.


 Here's this morning's SPY gap fill move and higher from there, we're close to some resistance so there should be some consolidation in the area, shorts won't be nervous until that first level of resistance is broken, then they'll start to worry and price moves will be stronger.

 SPY 15 min chart is picture perfect for a strong swing trade on the upside.

 SPY 10 min looks similar.

 Here's the set up I mentioned above, a positive divergence sending the SPY higher, an almost immediate negative divergence on the gap higher and as SPY breaks support, another positive divergence, the red arrow today was the opening for the gap fill.

 Short term 5 min is leading positive in a big way to new highs on that break of support.


However, like the other averages, the big picture looks very different....
4 hour leading negative SPY

AAPL, QQQ, NDX Futures (short and long term)

As should be clear by now, my longer term outlook on the market in general (not every stock) and AAPL in particular is bearish, however short term it's more bullish which should work well to set up an AAPL short in to better prices with less risk and higher probabilities. The break in AAPL below a H&S pattern not only confirms the pattern we suspected before it even made the first right shoulder, but also seems to be confirming our tactics when dealing with H&S tops, we never short the first break. If we can short AAPL at the top of a head or shoulder that's fine, but chasing the first break almost always sees all of those shorts (that all enter at the same time on a confirmation move below the neck line) squeezed out and replaced by smart money; yes the H&S is a bearish price pattern and yes it is reliable, it just doesn't work like the textbooks have shown for nearly a century as technical traders are too predictable and Wall St. uses that to their advantage every time and H&S tops, being so reliable are also some of the most manipulated price patterns. In any case, that's all good for us, it plays in to our hands.

Here are the charts for AAPL the QQQ and the NQ (NASDAQ mini futures) which all are very closely correlated.

 AAPL 1 min saw a stronger leading positive divergence on this morning's dip

 As did the AAPL 2 min chart with a strong leading positive move on that dip, think about what happens with traders on a dip like that and why there would be a strong leading positive signal in an area of price weakness like that at the same time.


 AAPL 10 min shows 2 areas of positive divergences, I wouldn't be surprised if they were actually 1 area separated by a bounce in which institutional money was not willing to chase AAPL.

 The QQQ 2 min saw the same leading positive divergence this morning after a smaller opening negative divergence as you can see at the red arrow.

 QQQ 3 min also showing the sale leading positive to a new high at the same time and on the same dip as AAPL.

 As for the futures, I mentioned they were starting to improve and the market, AAPL and the QQQ specifically moved up from there.

 As shown earlier, this 5 min NASDAQ futures chart is positive and has been so for longer than the chart history will show.

 As is the 15 min chart

 And the 30 min.

Bigger Picture...

 While I want to see near term strength, the bigger picture for AAPL doesn't look good with this 4 hour leading negative divergence at the H&S top.

The QQQ 4 hour chart looks similar to AAPL's, leading negative at the H&S top.


 Last week support held under the neckline, shorts entered as AAPL crossed below the neckline, we are looking for the upside move that shakes these shorts out and allows us to enter.

This is a 60 min version of the same area above and what we are looking for, so yes I think AAPL can be played on the long side very short term, but the higher probability, larger picture trade is AAPL short as long as we can get better positioning.

FXP/FXI China

Last week I mentioned FXP as a long I liked, this is short the China 25 (leveraged ETF)

I'll also include FXI the long version of the ETF as confirmation, I went ahead and added FXP Friday as a long equity.

 The last few days, FXI  gapped quite high above support, I think this is the head fake move in FXI/FXP as the head fake move typically has some relation in its size vs the previous trend (since Sept.).

 FXI (long China) and FXP (short China below) are both in a flat range which is where we most often see accumulation/distribution, I like these ranges as tell-tale signs.

 FXP 60 min

 FXI, the long version is falling apart sharply on the 2 min chart as it gapped above resistance, an unreasonable gap.

 A longer 5 min chart is negative at the same place making the head fake move more probable.

 Even the mid-term 15 min chart deteriorated badly on the gap up.

 FXP, the short version (position entered late Friday) is moving up in a leading positive divergence, confirming what was seen on the FXI short term charts.


 FXP 5 min is also leading positive, also confirming what was seen on the FXI charts (the 3C signal should be the opposite of FXI).

And the longer term 15 min chart is leading positive, also confirming what is seen in FXI, that's a lot of confirmation between the two ETFs.

I continue to like FXP, especially on a head fake move with confirming 3C signals.

Market-FAS

As mentioned in the last 2 updates, AAPL was improving and the market was filling gaps and improving, the gaps are filled and both the market and AAPL are responding positively from positive divergences that I mentioned building up after the opening small negative that sent the averages back to fill the gaps.

FAS was one leveraged long ETF last week that started pulling itself together, it's still looking good and continues to pull itself together for what looks to be an upside breakout from the triangle.

We'll still be looking to short in to price strength as that is the larger picture, but we should have a decent bounce that scares shorts out of positions first.

FAS....
 Friday's daily closing, bullish reversal candle on increased volume in XLF (Financials), also in a head fake area which is what is almost a prerequisite fro a reversal in the market now-a-days. We're looking for a break above the triangle.


 Financials were late to develop vs most other sectors, I think the fact they didn't lose much ground didn't make them as attractive as they were in a consolidation/triangle, but late in the week as it looked like everything else was gearing up to move higher, Financials started seeing the same positive activity in underlying trade come about as you can see in this 2 min FAS chart that is leading positive.

 There's migration to the 3 min

And to the 5 min.

AAPL

AAPL looks like its hitting its morning lows, the short term AAPL charts are now improving as well as the NASDAQ futures and the QQQ's are starting to improve off the opening non-confirmation gap up, which wasn't that bad of a negative divergence, a gap fill from that divergence makes sense.


Overnight

Overnight the Euro as you saw tumbled, initially it seemed that it happened as the market realized that China was not going to follow other central banks and flood markets with money/liquidity, the EUR/USD and other key pairs didn't act well initially, but there was really no great news to send the market higher overnight, which is what we saw, the positive divergences that built last week were there, the break below obvious support (head fake move) on Friday was there, but there didn't seem to be a catalyst and there didn't need to be one, the only catalyst I can think of is the weekly op-ex pin past and the cycle for the market to move up on a volatility shakeout of the shorts was now ready to be unleashed, this is where many market participants make the mistake of listening to CNBC and wanting to know why the market did something, we have a need to know, but in most cases, it's smart money setting these cycles up in advance and whatever news is available is used to explain the moves, even if the news doesn't correspond with the moves like the overnight recovery in the FX and futures market.

The best excuse I've heard is that the market moved because Greek yields dropped, but as shows, the AUD/USD and the futures market were already recovering well before the Greek/European bond markets even opened... so much for that excuse. This was based on weekend news that the Troika may be willing to give Greece 2 more years for austerity targets they have already missed, the important part was Germany coming back over the weekend and essentially ruling that out. Greek debt yields are low because Dan Loeb said he had been buying GGBs which causes other herd-like hedge funds to follow, Loeb no doubt was selling what he bought to them, selling in to strength.

On US economic Data, Retail Sales in the US beat expectations at 1.1% vs consensus of .8%. Last month of course was revised down from 1.2 to .9%.

The Empire F_E_D came in at -6.16 vs last month's -10.4, but missing consensus of a -4 drop, better than last mont, not as good as consensus, a miss. Every sub-index except New Orders, declined, this includes, inventories, prices paid, employment, shipments, delivery times, unfilled orders, etc. On the whole, not a good report and the 3rd monthly miss in a row.

As we saw in bank earnings last week, Citi's net income beat expectations on the same accounting gimmick seen last week and which will be seen all earnings season with banks, they simply shift loan loss reserves over to income, a simple accounting gimmick to make earnings look stronger than they are and another reason why I think QE3 won't only be different, but was in fact a panic move based on banks' reserves which are not enough to withstand another decline in the economy or shock brought on by Europe, the F_E_D seems to want to get ahead of it this time unlike 2008 and earnings for financials are confirming this line of thought as the only way they can beat expectations is through obvious accounting gimmicks.

As for the market right now... Gap filling, that seems to be all we are seeing so far this morning.


Market Update

Here are the opening indications for the averages as well as last week's underlying trade which shows more history than the futures.

 DIA 2 min with a slight non-confirmation on the open, but a decent positive divergence Friday.

 DIA 15 min in a leading positive divergence through most of last week, also the typical head fake move (at least it appears to be) that we see right before a reversal as DIA broke under support and now back above it on a positive divergence.

 IWM was in leading positive position (2 min) from Friday to start with, there's a relative (smaller) negative on the opening gap up, but overall the 2 min chart is still in a positive position, this is typical of a.m. trade

 IWM 5 min trend through last week shows positive divergences starting last Tuesday and building last week since. Also the typical head fake break below support.

 QQQ 2 min slightly negative on the opening gap

 QQQ 15 min also started going positive Tuesday and built through the rest of the week

 SPY 2 min was leading positive from Friday on the open, a very minor relative negative divergence on the gap up, still the chart is in leading positive position.

The SPY 15 min chart also started building a positive divergence Tuesday through the rest of the week with a break below support Friday. almost certainly a head fake move.

I would still consider this an area to open or add to long positions you may like as we haven't moved that far from the lows and risk is still pretty low on any new long positions. I prefer leveraged ETFs for a swing type move.

Early Futures

With Friday's apparent op-ex pin over, we should now start seeing the upside volatility shakeout of the shorts that was building last week.

Here are the FX markets and key S&P and NASDAQ futures market as of the 9:30 N.Y. open

 Above is this week's open in the EUR/USD at the green arrow, I watched this for several hours last night vs the AUD/USD. The Euro dropped pretty hard on the open and initially took SPX futures with it, but as it stayed hovering around the lows, I had a good feeling the futures would recover because of the following charts.

 The more leading indications of the AUD/USD did not hover near the lows for nearly as long nor did the futures, I went to bed with a good feeling we'd see the futures recover overnight as they did.


 1 min ES-SPX Futures shows the initial dump with the Euro to the far left, but there was a positive divergence there and the futures recovered, the green arrow is the European open and by the US open the SPX futures were in line with price which is better than the negative divergence creating a consolidation earlier in the morning.

 The 5 min chart of ES is more important, just as the 15 and 30 min charts, even though we can't see as much history on 1 chart, there's a strong positive divergence through most of last week and this is a strong indication the market is ready to make that move higher, this is why I said on Friday if you have longs you are interested in, now is the time to start wrapping up positioning.

 NASDAQ 1 min futures since the open yesterday seeing the initial dump with the Euro, but recovering much quicker than the Euro, these are showing a positive divergence in to the open.

Again the 5 min chart doesn't show the full wee from last week, but there's a strong positive divergence from last week, this should play out this week in the volatility bounce.


More opening indications coming...