Although we should be consolidating/pulling back for a while this afternoon (we still may close strong), the underlying trade is just blowing away my expectations with improvements that are huge considering the chart length and how long the market has been open today, I do think that gap fill this morning was a lot more than just that, in other words I think institutional money was very busy on that gap fill .
SPY 15 min
The SPY is coming up to first resistance, it's a break through second resistance at the white arrow /upper trendline that will get shorts nervous being that's where the SPY failed from. There is some chance we get some symmetry similar to the AAPL H&S which wasn't perfect, but this does look a bit like an inverse H&S bottom with a left shoulder, hear and the upswing of the right shoulder which would still need a pullback and another swing up through upper resistance to complete, that's just a possibility, not a probability, but we need to consider all situations as we can make plans and no what we want to do if X, Y or Z happens.
We could also have...
A large head fake descending triangle, this tells technical traders to expect more downside and they would have actually already shorted the price pattern on the break below support last week.
Volume isn't perfect, but a wedge of this size is entirely possible without having the drawbacks of acting like a wedge, in other words, it would be organic rather than engineered.
DIA
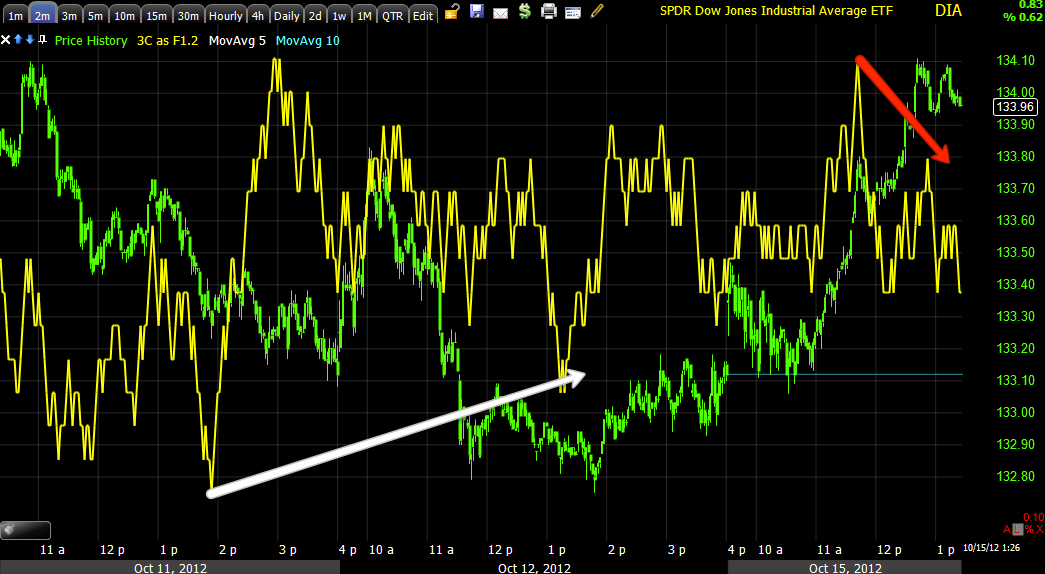
DIA intraday looks ready for a pullback/consolidation, but in context, it's really a minor signal.
Most of the new highs in the 15 min leading positive divergence were added TODAY ALONE!!! Everything in the box was today alone and the DIA had been the ugliest of all the averages.
QQQ
QQQ 1 min negative divergence/ intraday pullback, but....
Again, the 30 min in this case saw a lot of upside in the leading positive added today alone.
SPY
SPY 2 min intraday looks ready for a pullback after good confirmation today.
However once again, the 15 min chart which is a serious timeframe is seeing a new leading positive high above the highs of more than a week ago and all of that in the right, white box was added today alone. We don't often se such large 3C moves on such long timeframes in so little time/space, this typically means institutional activity has picked up big time.


 | Theme by Thur
No comments:
Post a Comment