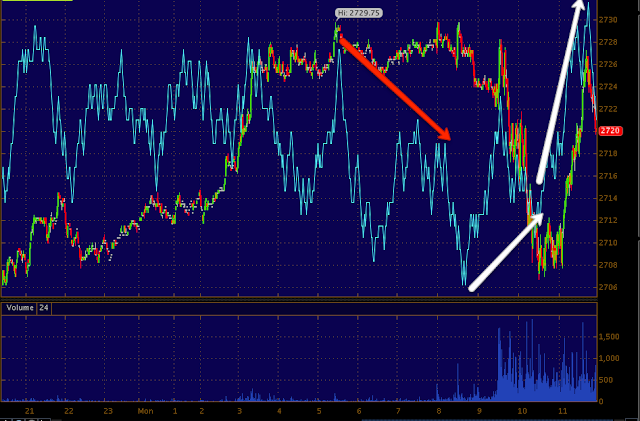
Here are the charts for AAPL the QQQ and the NQ (NASDAQ mini futures) which all are very closely correlated.
AAPL 1 min saw a stronger leading positive divergence on this morning's dip
As did the AAPL 2 min chart with a strong leading positive move on that dip, think about what happens with traders on a dip like that and why there would be a strong leading positive signal in an area of price weakness like that at the same time.
AAPL 10 min shows 2 areas of positive divergences, I wouldn't be surprised if they were actually 1 area separated by a bounce in which institutional money was not willing to chase AAPL.
The QQQ 2 min saw the same leading positive divergence this morning after a smaller opening negative divergence as you can see at the red arrow.
QQQ 3 min also showing the sale leading positive to a new high at the same time and on the same dip as AAPL.
As for the futures, I mentioned they were starting to improve and the market, AAPL and the QQQ specifically moved up from there.
As shown earlier, this 5 min NASDAQ futures chart is positive and has been so for longer than the chart history will show.
As is the 15 min chart
And the 30 min.
Bigger Picture...
While I want to see near term strength, the bigger picture for AAPL doesn't look good with this 4 hour leading negative divergence at the H&S top.
The QQQ 4 hour chart looks similar to AAPL's, leading negative at the H&S top.
Last week support held under the neckline, shorts entered as AAPL crossed below the neckline, we are looking for the upside move that shakes these shorts out and allows us to enter.
This is a 60 min version of the same area above and what we are looking for, so yes I think AAPL can be played on the long side very short term, but the higher probability, larger picture trade is AAPL short as long as we can get better positioning.


No comments:
Post a Comment