Monday, November 19, 2012

Market Update

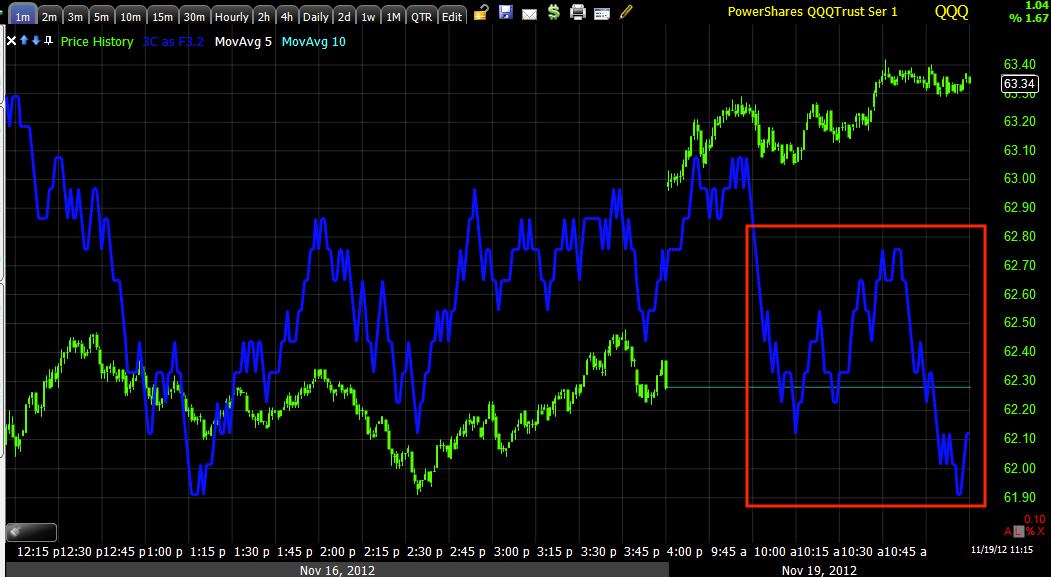
ES has an intraday negative divergence as do several of the averages, the market is so fast moving that trying to capture more than a few charts is worthless as the market will have already changed by the time I'm done. I'll use the QQQ as an example.

 Intraday 1 min the QQQ as well as the NASDAQ futures look like they want to consolidate and remember, Wall St. isn't going to make anything easy.

However,

 Intraday charts longer than 1 min like the 2 min above or 3 min below aren't showing any migration of the 1 min divergence, thus it doesn't appear to be very strong, it doesn't appear there's any mass distribution in to this move, but perhaps enough to make people think so intraday as it is still very early for the market to hold these gains.

 3 min

The bigger picture is the entire cycle from Oct. 18th's decline, this 15 min chart shows what looks to be a very powerful move coming and this is why I say this could go right through year end.

As for the leading indicators, every single one is in line of better, they look good.

The main mover and the main component that we were waiting on was the $USD, it is now down almost completely below a nearly 2 week range and has confirmed the suspicion that Friday's move above a clear range/resistance was indeed a last gas head fake move.

UUP/USD daily chart

So far the longer term picture is falling in to place and today looks to be the start of the price move, although last week was the start of extreme momentum to the bullish side that we rarely see.

Short term, I'd rather take initial investments off the table and let profits run on a position that is up nearly 100% in a few hours, AAPL.

Closing Half of Dec $540 AAPL Calls

This is essentially taking the original investment off the table and letting the profits run, or guaranteeing at least a break even trade in the worst case scenario...

I'll show you why in the next post, but it has nothing to do with the cycle, it has to do with my low tolerance for any pullback or even consolidation in a highly leveraged product like options, this wouldn't change anything as far as an AAPL long stock position.

So 1/2 would be closed.

AAPL Update

Friday's December $540 calls are killing it, up at least +80% now. I'm not one to be greedy, especially with leveraged products, but I've also taken these profit way to early and regretted it. I want to let AAPL get in to the Trend Channel and look over the market in aggregate before making any decisions, of course any major pullback, even if I'm expecting much more upside, I'd rather see the position closed and re-entered at a better price on a pullback. Don't forget some AAPL equity/stock positions were opened as well and they are now up nearly 4% so there's a different Trend Channel for those which will be wider.

Here's where AAPL is as far as getting close to being able to use the Trend Channel...
 For options I'd like to see this 15 min Trend Channel catch up a bit more, it has already made a great move, but it needs to catch up some more and it should keep locking in profits and has about a 3 day trend in AAPL that it has been holding recently, combined with shorter term 3C signals, I'm hoping this provides a decent stop for Call positions.

 The 60 min trend is more for the Equity positions and should hold well and continue to move up and lock in gains, but it too still needs time to catch up to the fast reversal in price.

 Lets not forget AAPL had/has a 30 min leading positive divergence, this is quite large and should support quite a large move that I think will surprise many on the TwitStream that are shorting AAPL right now.

The closer 3 min chart seems to have not only picked up a head fake move Friday, but indeed, perhaps an even larger head fake move from November 7th. In these cases the area where the positive divergence first begins, (around the 7th) we typically see price move well above the area where accumulation first started even though the averaged accumulated position is already most likely in the green.

It's good to see AAPL participate, I think it may catch quite a few people off guard and don't forget the head fake areas we already knew about Friday in this post...

The Backing and Filling

This will be interesting, over the past month (you could argue more, but I'm mostly focussed on this cycle) we have seen some big moves at the 9:30 open, in some cases they wiped out a great overnight session on the open, in some cases (fewer) we saw big moves up early on after a not so good overnight session, the point is, early volatility increases dramatically with the US open and often goes in a completely different direction than what the overnight trade suggests.

Then after the European close we see the market make another reversal from what it was doing in morning trade, however as I mentioned before, changes in character lead to changes in trend and changes in trend develop new character so this will be very interesting to see what the new character looks like.

So far there's an ES 1 min negative divergence, a SPY 1 min negative which is not as bad, the QQQ failed to confirm the open and the IWM confirmed and then put in a small 1 min negative divergence so this is some of the typical action we'd expect, the backing and filling.

I don't want to give you any false impressions that these divergences are worse than what I said, they aren't that bad, they are intraday timeframe and the market is reacting to them for the most part, the way we'd expect, but this is a fast moving market already this morning.


ES 1 min negative divergence, along the lines of a consolidation or normal intraday pullback. The NASDAQ futures have a sharper negative divergence, but then again so do the Q's.

So far the TICK is holding up incredibly well, for a while we didn't even break zero and the worst we've seen so far is a very mild -500.

I wouldn't break out the victory lap just yet, the market never makes anything easy, even when an open like this looks like it will be easy. However, I also wouldn't be too quick to judge anything that looks a bit ugly as there were a lot of clinger-ons thins morning apparent by the opening TICK of nearly +1800, in other words, a lot of Jonny-come-latelies and the market may be eager to shake them off.

So far though, all of the macro trends that have been developing in the charts and indicators are taking shape, especially with respect to the extreme momentum of the last 3 days of last week.

And before I can even finish this post, the market is now making another new high on the day, like I said, it's moving quickly. This isn't a time to make rash decisions, take it in, lets see what the character looks like, lets see what different environments look like and see if this is what we have been looking for, I believe it is.


Wow-Now some backing and filling...

The open went off with a bang, in the first 10 minutes of trade the SPX (S&P-500) hit levels that were nearly +1.5% up and where some very respected technicians thought the SPX might make it to on an oversold bounce correction over a period of several days, all that in 10 minutes.

However it looks like there were too many people on one side of the boat too early and while I'd love to see the upside gap stay completely open, we know from experience it's not likely, especially this early in the session, but on the other hand this is a different market attitude/sentiment now so it will behave differently. If we see a few more moves like that, we'll have a short squeeze and the kind of momentum that does make the papers for the average Joe to gain some confidence in to Black Friday shopping.

Thinking about the size of the divergence and how long it's been put together, I'm leaning toward not just a strong move, but perhaps a move that goes easily in to year end, of course the Fiscal Cliff may make that difficult or volatile, but the market put in the time to create a range and head fake move large enough that this could be a possibility.

One Bridge at a time...

Take a look at the TICK


 Talk about extreme, the open was +1778, almost 1800 which is a level I don't remember the last time I saw, the TICK has also managed to stay above zero so far the entire open.


Pre-Market Indications

There's a very small negative divergence in ES that has formed since the last update, maybe we see a bit of gap filling, however once again right now it's really not that big and only appeared after new overnight session highs were reached.

ES 1 min

We have quite a decent gap this morning so this wouldn't be surprising at all to see a little backing and filling early on.

Pre-Market

Last night we had a 1 min negative divergence in ES (S&P Futures) for about 6 hours, this while last week I posted the 5, 15, 30, 60 min ES charts all with never seen before positive divergences, making me feel comfortable with taking on more long exposure Friday.

Last night's divergence as is seen on the 1 min timeframe, can cause a pullback or lateral consolidation, either way it's called a consolidation, it's an intraday chart and generally not an important signal to the bigger picture. This divergence last 6 hours and about an hour and a half after I posted this at 11:30 last night the divergence not only ended, but ES started moving up again after it had only really pulled back  about 4 points total.

Furthermore, last week I mentioned the $USD will be very important for the market to get its footing to put in an upside reversal, I showed some signs of that happening last night and they carried on through the night, making last Friday's pop of the $USD above the nearly week long range look exactly like what I thought it was, a head fake move as they are usually the last thing we see before a reversal and in thi case for the market, a $USD downside reversal is important for the market to move up.

If you are looking for good news from the overnight session to explain this, it really isn't there, in fact there was some bad news coming out of Europe, but if we look at the charts and especially the second half of last week, we saw extreme upside momentum and the ES divergences that I've never seen before, something that looked a lot like final preparations seemed to be underway.

Of course the market always sees a dramatic move in momentum at the 9:30 open so we'll have to wait and see how that goes, the afternoon trade is always more important, but who knows what we'll see, as mentioned last night, to make the news and get consumers feeling good before Black Friday, the market would have to really impress to the upside and fast.

Right now we are set to open with a nice gap up which also makes a lot of sense after seeing the reversal daily price candles in averages, stocks and Credit, there were some big ones.

Here are the charts.

 ES starting the new week dipping and consolidating on last night's negative divergence.

 ES from the same point last night to the left, the European open at the green arrow and upside momentum since then despite bad news.

 The current 3C/ES chart...


 The EUR/USD since the start of trade for the week...

More importantly on a 5 hour chart, the range and had fake breakout in the US Dollar index and drop since then, this is what we needed to see.

There were hints everywhere, in fact they were pretty much screaming, as I said Friday, I feel very comfortable taking on a little extra long side risk.

Here's one of many of the daily closing candlestick reversal patterns, but this one is huge and in HY Credit...


If I had more time I'd link to all the examples from Wed-Fri. last week that were extreme momentum moves, they are available in the archives at the right side of the site.

Sunday, November 18, 2012

ES Overnight

Just looking at the ES futures, after hitting a high of 1365+ it looks like there's a pullback coming in to the European opening which is in about 3.5 hours, however that doesn't mean a lot this early in the overnight session, but the signal looks pretty clear. We'll see how it worked out in the a.m. and what comes next.


News that Moves the Market

So far the only possible biggie I see is this one from Stratfor, "Rumors on a Gaza Cease-fire"


Opening

While it's way too early to come to any conclusions based on the opening indications, it is useful to know at least where it has opened.

 So far in a little less than an hour of opening trade, ES (S&P E-mini Futures) has been trading up from Friday's close.

 The EUR/USD has also opened and moved up thus far, however last week we saw the Euro up and the $USD up as well, which is not typical, however there is some early evidence the $USD is falling a bit so far which is what the market needs to move higher, while the Euro is a good proxy because the $USD usually trades opposite the Euro, as we saw last week the $USD managed to stay up while the Euro moved up.

 Here the AUD is up vs the $USD as well

 Also the GBP is up vs the USD as well as are many popular FX/Currency pairs, this is something we recognized last week as being important to a reversal as well as seeing some sharp momentum in the EUR and USD charts that suggested the $USD was ready to make a move lower as last week for most of the week it held in a lateral range, except Friday it jumped a bit above that range which may indeed have been the head fake move that so often precedes a reversal.


The $USD Dollar Index ha also opened and moved lower, at last check it was at the lows of the day even though we only have about an hour in thus far.

Other than the charts and the indications that suggest an upside reversal,I would think those that have the power to move the market in the near term would like to see it higher this week with Black Friday coming up, you know- a little consumer confidence, but for that to make news for the average person, the move up would need to be sharp... Just a Thought.

More as it develops.