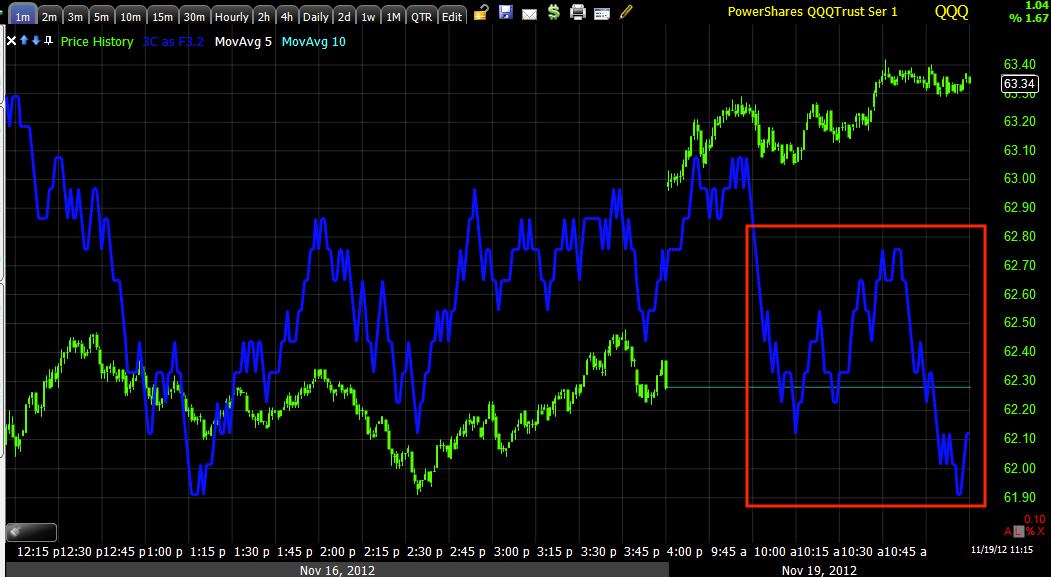
ES has an intraday negative divergence as do several of the averages, the market is so fast moving that trying to capture more than a few charts is worthless as the market will have already changed by the time I'm done. I'll use the QQQ as an example.
Intraday 1 min the QQQ as well as the NASDAQ futures look like they want to consolidate and remember, Wall St. isn't going to make anything easy.
However,
Intraday charts longer than 1 min like the 2 min above or 3 min below aren't showing any migration of the 1 min divergence, thus it doesn't appear to be very strong, it doesn't appear there's any mass distribution in to this move, but perhaps enough to make people think so intraday as it is still very early for the market to hold these gains.
3 min
The bigger picture is the entire cycle from Oct. 18th's decline, this 15 min chart shows what looks to be a very powerful move coming and this is why I say this could go right through year end.
As for the leading indicators, every single one is in line of better, they look good.
The main mover and the main component that we were waiting on was the $USD, it is now down almost completely below a nearly 2 week range and has confirmed the suspicion that Friday's move above a clear range/resistance was indeed a last gas head fake move.
UUP/USD daily chart
So far the longer term picture is falling in to place and today looks to be the start of the price move, although last week was the start of extreme momentum to the bullish side that we rarely see.
Short term, I'd rather take initial investments off the table and let profits run on a position that is up nearly 100% in a few hours, AAPL.


No comments:
Post a Comment