Monday, January 14, 2013

AMZN Update

Friday I updated AMZN (actually twice) which is a position I like, I think it's an ideal position for a phased entry.

My thoughts on Friday were two-fold..

"Ideally AMZN looks the best above $269"

 "if I had time I'd probably add to the AMZN short opened this week I believe it was. I'd prefer not to be at a full position yet until the market is in line as well."

The market being in line as well is for pretty obvious reasons, the market is responsible for probably somewhere around 65% of the gravitational pull on any given stock on any given day (of course excluding stock specific events), simply said, most stocks move with the market so having the market in line with the individual position is a no-brainer.

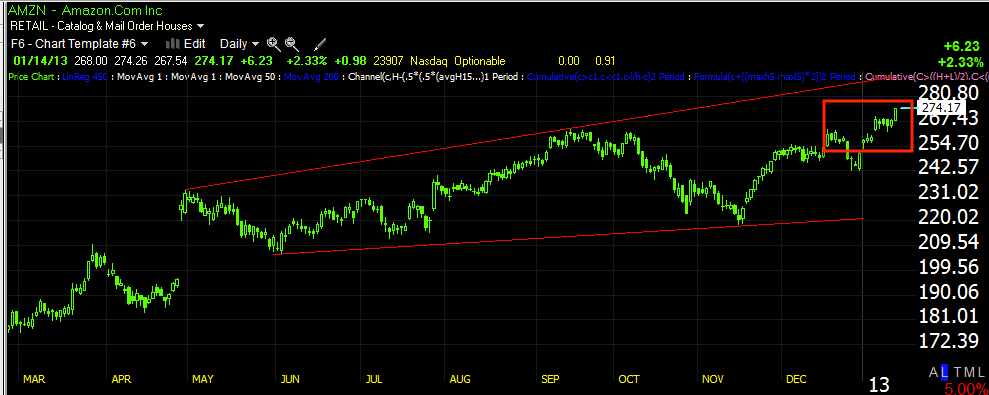
The reason I'd prefer not to be at full-size in AMZN yet (as of Friday) is because of this...
 That resistance zone is too defined, it's too obvious of a target, and it leads to new highs, all of that leads to increased demand, price, etc, everything that is useful in putting together a short position or selling a long one if you just happen to be dealing with positions that are not in terms of 100 lots, but in terms of percentage of outstanding shares.

There are a lot of other reasons as well, I can't list them all here, that's why I wrote the first 2 parts of the 3 part article, "Understanding the Head-Fake Move", there are a lot of reasons. I'll be sure o get a link to those two articles up on the right side of the site so you can reference them. Look at the Industry today, retail, it's up about .30% so this move isn't about a strong retail sector, the sub-sector is up a bit over 1%, but that's because of the 17 components, AMZN and EBAY are the biggest and EBAY(-1.21%) isn't performing like AMZN. I have little doubt this move is all about predictability of technical traders and that clear resistance zone that would move them to action as well as hit existing orders. It wold also just be silly to leave that much money on the table because you didn't make a move above resistance (the bid/ask spread, HFT trading, locals' trading, volume rebates and that's not even considering the bigger picture)


 Volume spikes on a 1 min bar at 9:33 a.m.  the same time AMZN moves above that resistance zone, orders were piled up there, easy money for all kinds of Wall St. players.

Looking at the bigger picture this looks like a broadening top, I didn't include volume because it's kind of irrelevant in a broadening top, tends to be all over the place. Right about this area we are in now is the typical place a Broadening top fails, when they do from this area, they typically fail pretty spectacularly.

This is a closer view of a 15 min chart and about the area that trend #1 would  have move most of the market, 3C is in leading negative position as a 15 min chart "Can" as we have seen, confirm price in a single day, not even close here.

If we take a broader look at the same 15 min chart, there's an obvious change of character recently. There are charts that look much worse than this like the daily, but I'm not sure that's the trend we are targeting right now, but you should know that because it is part of the probabilities factor.

Looking at the intraday trade, the 1 min chart is not confirming either, it's starting to lead negative, actually, let me update this chart, this is what it looks like now since this last capture...
 Most current chart-1 min

Closer view.

The 3 min chart looks about the way it should considering where the 1 min is.

As does the 5 min chart.

So far the 1 min chart is moving the direction I'd expect and want to see, I'd like to see the others follow and I suspect as the 1 min is getting worse in a short period of time, they will follow and that's where I'd like to add to AMZN.

If I had to make a choice this second to add or miss the chance, I'd add no doubt. However I do prefer to have the strongest signals so in light of that, I'll be patient, but I like what I see so far.

SQQQ Example-Don't Get Lost in the Lines

Don't get lost in the lines, kind of like seeing the forest through the trees. Sometimes we get so fancy trying to nail something exactly that we miss our chance, that's something each person has to examine individually and decide whether you have good reason (that might depend on your portfolio positioning, for someone who already has good exposure, you may have higher standards for any add to positions) or whether you are more interested in being right (hitting the exact top) than making money, believe me that conflict is real for many people to some degree.

Looking at SQQQ-the QQQ 3x leveraged short or bear ETF (and like the SPY, I'm just using this as an example-I actually like SRTY here a lot), here's what we have and I'd say this is a pretty decent area to own some SQQQ.

 This is a pretty important longer term chart, like trend 2, the last negative divergence is the start of trend #1, since we have a decent leading positive divergence on a 30 min chart, it will look sharper and larger on shorter timeframes, but the longer timeframe chart is the stronger signal.

 The 15 min chart turning negative right before trend #1 pops and a leading positive divergence here too, most of it recent, remember the market needed to get above the 1/4 highs before we really started to see signals.

 Like I said above, a 5 min chart like this will appear to have a stronger positive divergence, it's more defined, it looks stronger, but there's no comparison between  5 min chart and a 30 min chart, the 30 min is showing us a much stronger chart (it's not disagreeing with anything on the 5 min, it's just the further out the signal goes, the stronger it is).


 Now coming back around at this from the short end on the intraday 1 min chart, this looks very strong, it has gone from strong relative divergences to a strong leading divergence which is commonly the way these divergences transition.

The 2 min chart is strong as well, not quite as strong. Big picture I have no problem owning SQQQ right here. Smaller picture or what I call tactical, there's a gap, we have seen the last  several days see afternoon market rallies ( a decline here) as the VIX is manipulated, but we have to weigh that against a gut feeling that I've had since we first predicted trend #1 and before it launched and that is, the market turns very fast, it doesn't give us the usual "process" of a reversal, but more of an event which is not common, but that's my gut so you have to weigh those and decide, but I'd want some exposure by now, actually personally I'd like to be about 75% complete with the short positions I intend to have in place or have been in the process of phasing in to.

I'll continue to feed you as much information as I can so the decision is easier, but a pullback in SQQQ would be a no-brainer to me, even right here I think it looks like a great position.


Market Update

We'll skip opening indications, there really wasn't much to see; a bit like Friday, this market is pretty slow, the TICK chart shows that pretty clearly and there really isn't a lot economically today, earnings pick up tomorrow so we may see more action toward the end of the day today.

Here's what we have so far and I'm going to use the SPY as an example because every average looks very similar, the theme is the same among the majors.

 The 1 min positive divergence this morning is only a relative divergence, the weakest kind so it's not anything that is disturbing our expectations.

 Take a look at the leading negative in the 2 min chart, there's nothing positive here.

 And that is migrating over to the 5 min chart.

Finally most importantly, the 15 min chart leading negative, most of this is all above the 1/4 highs as anticipated.

Based on these signals alone, I'd definitely want some short coverage and we do have short positions already put together for trend 2. The thing to consider is whether they try to bang the close or afternoon trade with the VIX, even if they do, I'd still be leaning toward a portfolio that is definitely biased toward the short side. I'll look at the VIX indications and see if there's anything there as well as some of the inverse market ETFs like SQQQ, SPXU, UDOW, FAZ, etc. They should be showing some things to.


Quick Update

I'll post the Opening Indications charts, but right now they are all starting to lead positive intraday including ES, but excluding the IWM. Also the TICK has finally gone positive, it hasn't been a horribly negative morning for the TICK, but almost all of the time has been spent in the negative below zero.


AAPL-The Crowd Mentality

I have been warning about AAPL all of 2012, the late April decline I said was a defining moment for AAPL and only in the future looking back would people realize it; we are now below those levels.

Here's the area I was talking about...

I caught a LOT of flack from AAPL longs and lovers for saying what I said because everyone thinks in terms of what a stock did this afternoon or the next day and if AAPL was up, well then whatever you say is dismissed and when AAPL falls, then it was just a lucky guess.


However AAPL has been on an uptrend for at least 10 years now.

Note the change in volume, a healthy uptrend sees expanding volume, declining volume is a warning sign.

As for the warnings and AAPL's performance...If I said anything the response was, "AAPL just made an all time new high". I wonder how those longs are faring now?

Take a look at AAPL performance...
The performance up to about the time I started seeing major trouble brewing long term for AAPL and the performance since.

And what was the problem I saw in AAPL? I couldn't tell you then what the real fundamental problem was, but someone saw something and as always with underlying trade, if you wait for the reason for the signal, then you have certainty, but you don't have profits.

Here was the problem (unfortunately many of the hints were on timeframes that we can't see as we have 5000 bars of history and in some of the intraday timeframes we can't go back that far.
Longer term the problem is pretty clear and when it even started, you have to remember how Wall Street thinks, "He who sells first, sells best", selling in to higher prices in a bubble is what they do, I'm not saying they were out of AAPL by 2009, not at all, but the nature of their holdings changed dramatically. A 5 day chart tells us a lot about the overall health of a company this big, but it's not tradable information, maybe long term investable.


 This 3 day chart puts a little finer point on the problem, but doesn't identify the area where something really changed.

 Here on a daily chart, the leading negative divergence in April of 2012 was really the first time it was really apparent something was changing and this is when I really started warning people about AAPL, by the top, you can see a lot of money was already gone.

An hourly chart puts an even finer point on it.

As to why, you could say the passing of Steve Jobs, you could say what I said when the IP5 came out, "This is the first release that is evolutionary rather than revolutionary" and that is what is dragging AAPL down early today, talk of declining IP5 demand.

However more than anything, I think AAPL got too big for their britches and forgot how finicky the crowd is and how strong the crowd mentality is, just ask MSFT or RIMM.  When AAPL started demanding exclusive rights to content, one of the best examples is AAPL TV which will probably never be what it could have been because of AAPL's need to have exclusive rights to content. They made a mistake with the IP5 just like MSFT did with Vista, they were laying catch up to AAPL as AAPL was playing catch-up to Samsung, then the whole Samsung, "Bite the hand that supplies" debacle. Now we are hearing about an affordable AAPL I-phone, so everyone can own a piece of the status symbol, but that's when it's no longer a status symbol.

I can see a point not too far away in which we hear about AAPL stores closing in areas, AAPL in my opinion has just found out how far they could push accommodation for mass demand while trying to maintain an exclusive status symbol and they crossed the line, once that happens the crowd can turn finicky pretty quick, Tim may be well advised to take a close look at the Blackberry, once called the "Crackberry".

No bubble lasts forever and I really do wonder how many people have lost a lot of money on AAPL since I first started warning there was trouble and how much more they'll lose in the future thinking that with AAPL, "This time it's different". It's never different with bubbles,  the growers of a rare diseased Dutch Tulip could tell you that hundreds of years ago.


QQQ Opening Indications

It's a bit early for opening indications, especially for early morning trade on a Monday, but I thought the  intraday signals from Friday were interesting which will lead to a broader discussion about AAPL in a following post.

Here's the QQQ intraday charts (and beyond) for Friday and this a.m.

 This is the QQQ 1 min intraday chart from Friday to this morning , note there was no positive divergence in the QQQ at the green arrow as 3C was moving with price until it went negative later in the afternoon. As of now the QQQ is pretty close to intraday confirmation.

 The bigger picture and this is more the bridge between trend 1 and 2 that I had said so many times, "We won't see much movement in underlying trade until the SPX passes above the 1/4 highs), which happened Thursday of last week (the 10th), there you see distribution on an opening gap and a leading negative divergence as we continue forward, this is the bridge to trend 2 that I spoke of last night in saying the things we'd expect to see we are seeing and where we'd expect to see them.

Of course the Q's are taking it on the chin because AAPL is taking it on the chin this morning on talk of decreased demand for the IP5. but that's another subject and I'm not going to jump to conclusions there about short term trade based on 30 mins. of a.m. trade, but there is a discussion about AAPL worth having.

 The 10 min chart (the longer the timeframe, the more seious the signal) has gone leading negative which just about completes the bridge that was already negative at the 15 min chart, so since we moved above 1/4's highs, we have seen a lot of underlying movement.

Here's the 15 min chart, the more important chart which basically calls trend #1 a move that can't be sustained, which is what we said about trend #1 before it even made the first move to the upside, it was always meant to be the shorter of the 3 trends we have signals on.

However this is really a segue to a conversation about AAPL, not so much short term, but more macro.

Other opening indications will be coming shortly as well, remember though so far this is early a.m. trade which is typically quite deceptive, a lot of traders I know (professionally) won't even look at the market until 10:30 -11 a.m.


Pre-Market: More Ambiguity

There was no dominant Price/Volume relationship Friday, the TICK data was as boring as I've seen it, it seemed like an op-ex pin day and that continues this morning, we are set to open down to slightly flat.

There's no real tells in pre-market trade , the only one was around 11 p.m. last night, but that still barely moved the market.

ES pre-market...

Even the parabolic moves in the EUR/USD were absent. There was a negative divergence in the pair overnight, again around 11 pm, but so far that's about it.

The only real news flow has been slightly to the negative side. We'll wait for the opening volatility and see if anything pops up there.

Sunday, January 13, 2013

A New Week

I hope you were able to see last night's very late night post regarding Tom DeMark's signals, while I try not to follow other people's opinions and analysis (especially anything on CNBC or from Wall Street analysts, especially Goldman unless it's used as a reverse indication) as I believe it can skew your own analysis, I do feel better being on the same page as DeMark; just because I don't closely follow him doesn't mean I don't have great respect for him based on objective data.

In any case, as we had been looking for all week last week, we finally got the move above the Jan. 4th S&P highs. I had said many times last week that I didn't think we'd see much movement in 3C until we were above those levels as they do serve a purpose as I have elaborated on many times.


Sure enough, as we moved above that area, we started seeing more 3C signals and action, skewed toward the negative as expected.

The VIX has been very interesting lately and exceedingly volatile, I would say it's pretty clear that rather than using highly weighted stocks among averages, it seems that the VIX is being used to move the market, some of this I think is natural movement rolling hedges out past the debt ceiling deadline, which the VIX wouldn't show or at least it would be skewed as those hedges would be out to March and the VIX is a 30-day expectation of volatility.

 The recent volatility in the VIX is probably record setting in some ways, the December action looks very different from even the first trading day of January and I'm pretty sure that was hedges in December against long positions as volume was so low there was little way to reduce exposure for big funds with big positions. The change in January seems to be more about the Fiscal Cliff hedges being rolled out to the Debt Ceiling debate, but among all this action there's likely an opportunity to use volatility to move the market as needed.

 The VIX is now at intraday lows that haven't been seen since 2007, this is extreme complacency which historically has been a turning point in which the market declines.

 On a 60 min chart (VIX green/SPY red), you can see areas where the VIX seems to have been sold which pops the market up, many times this has happened in to the close or late afternoon trade, in any case, I thought we needed to see the SPX above the Jan. 4th levels and whether the VIX is being used to manipulate short term moves in the market or not, we are above that level all the same.

 We can't see intraday readings on the VIX itself, but on the daily we have the largest positive (leading) divergence in the VIX since before 2009.

Looking at the short term volatility futures like VXX which we can get intraday 3C signals, there's a clear change in character to a very positive leading divergence, it's so clear I didn't think I needed to draw on the chart (2 hour), this would seem to suggest someone or a group of someones have been building a large long position in volatility, especially when it's cheap. Remember the VIX and VXX move opposite the market so if this positive divergence fires and it is the largest I can see on an intraday chart, that would suggest quite a dramatic plunge in the market, similar to DeMark's findings.

As for the open in currencies (FX trade) for the new week...
 The EUR/USD has gapped up, but not by much. Goldman has a long call on the pair, the last 3 Goldman calls have been pretty major reversals, remember they are giving away information that they presumably pay millions of dollars to come up with, many would say GS trades against their own clients so I take their free information with a grain of salt, if not fade it-like I said, the last 3 calls we picked up were all reversals moving opposite GS's call (think about why they might do that beyond the obvious).

 Take a look at a bigger view of the EUR/USD and then take a look at the same chart of the EUR/AUD below...

 The $AUD is one of my favorite leading indicators among the currencies because it's such a popular carry trade currency, divergences (negative) between the $AUD and the market have had a very good success rate of calling reversals to the downside and vice-versa.


Here's the $AUD in red (about the same timeframe as above) vs the SPY, you can see the negative divergence at the red arrow sent the market lower, it looks like another is starting and judging by the chart above this, it appears the $AUD is being sold or the carry trade is being closed which is typically negative for the market as risk exposure is being dialed back.

A for the futures tonight...
 We do have an intraday (or night as it were) negative 1 min divergence in ES (S&P E-mini futures), I take this with a grain of salt as we have a long overnight session with a lot of markets still closed.

 However one thing I take more seriously are the following longer term charts. I said after trend #1 )the pop to the upside) started that I'd be looking for the ES 5 and 15 min charts to go negative, that didn't happen for several days, but it did very recently as the market moved above the level I said we'd likely see more 3C action. This is the 5 min ES chart with a 3C negative divergence.

 This is the 15 min chart with a negative divergence so both have moved to the negative, this doesn't mean there's an impending downside reversal tomorrow morning, but I can't see a reversal without these charts first having gone negative so it's kind of a part of the process that is playing out and right at the area in which I suspected it would. This would also fit by the way, with the $AUD (FX) charts as well as many others. The main thing I'm looking for now is worse 3C signals and leading indicators to go very negative, especially credit.


This is the 30 min ES chart that has been negative since trend 1 started, this tells me that trend 1 (the move up) is likely a strong head fake move as it was always expected to be even before it started, however the short term charts needed to go negative and meet up with this 30 min which is what is happening above.

As far as indications for tomorrow, I'd still expect some more upside or at least loitering in this area above the Jan. 4th highs, there's a reason for that, if you read the "Understanding the Head-Fake" articles, you probably understand why, if you are a long term member you definitely understand why and have seen it play-out so many times before, about 80% of the time before all reversals.

Friday gave no great hints, volatility was low, volume was low, it seemed like an op-ex pin, yes even on the weeklies; there was no hint whatsoever of a dominant Price/Volume relationship that would give a hint and that's no surprise as the NYSE TICK data was about as interesting and active as a market that was closed save for some late day volatility.

Ultimately though I do think things are moving as expected, things that should happen in the process are happening, so we'll be looking at more opportunities this week, stocks that are in good position now.

This all should be a nice edge for us as the spread in the bull / bear AAII weekly sentiment has most of retail (actually at a spread that is historically correlated with reversals) on the long biased side. In fact the magic number between the spread is 18...
Not only are we beyond 18 (currently 19.5%), we are seeing increasing bullishness and diminishing bearishness, being on the other side of retail historically has been a pretty good place to be. However this is just another interesting little piece of information, what strikes me is everything we have been looking for we have published about a week before it happened and it has been happening as we have been expecting so it seems we are very much on the right track.

All that's really left is to continue following the message of the market, although it's a message that few others know of, but like they say, "To make money you have to see what the crowd missed".

 The one gut feeling that I have had (which I cannot back up with data other than some hints like credit still holding up) is that when the market is ready to reverse, it won't be the normal "process", it will be an event, as I said last week and several times before, I wouldn't be surprised if it all happened in 1 day, from an extremely bullish move to an extremely bearish move.

Have a great week ahead, I'm thinking it may be a very interesting one.


DeMark Sell Signal

Many Technician's follow Tom DeMark's system/s, I personally never got too far beyond a basic understanding of his methodology, but I found it interesting enough to create my own DeMark inspired indicator; it is not anything like the Sequential (however I have seen some layouts of people who have set up DeMark indicators in StockFinder as its coding capabilities are extensive). Many of you have seen this indicator I use, which I really don't have a good name or really any name for other than the, "DeMark inspired" indicator.

In any case, the indicator only takes concepts from DeMark, it has nothing to do with 13 days really, but yet it has provided some amazingly accurate signals on all timeframes, I really don't give this indicator enough credit or feature it enough. I used StockFinder's BackScanner to really tweak the indicator to act like I wanted and to be robust in a variety of market conditions as well as assets. Maybe someone has a suggestion for a name for the indicator.

Here's the video discussing DeMark's call for a top in several European countries and the U.S. VERY close to a top, perhaps within days, which fits almost perfectly with all of the Trend #1 expectations that have so far been spot on. One of the most recent events that needed to occur in trend #1 for a reversal is we first needed to take out Friday December 4th's intraday high, the reason is to set up a head fake move, so it's not just about hitting the level although hitting stops and orders is one component of it, but more importantly if you have read the "Understanding the Head-Fake Move" article I have been publishing in parts, it's the demand and higher prices that are created on such a move that allow Wall Street to move out of big positions and start shorts, thin the size they trade and especially with volume as low as it has been the last several years, they need that demand and higher prices are just a given, they don't chase and they don't sell in to weakness unless they're in real trouble.

So DeMark's call is right there with our expectations. You may recall I said as early as last Monday, "We are not going to get good distribution signals until we are above that level) and as we moved above the level late last week that is the first day we started to get distribution signals. So I think what DeMark is saying fits very well not only with our expectations, but almost every concept we follow with regard to how the market works and behaves at reversals.

Here's the video on DeMark and below are several charts using my own indicator.


 DIA Daily buy and sell signals

 IWM Daily

IWM 2-day (The longer the chart, the more important the signal)


QQQ

 SPY

 Energy

 Financials

Technoology -as you know, the AAPL Call position is still open, still looking for a strong, but fast move. This isn't meant to be an AAPL update, but there are still some good signals to support the idea of that trade.

 AAPL 1 min saw a late day positive divergence Friday in to lower prices-classic accumulation.

 The 3 min chart, negative Friday morning on the highs after the gap fill and positive going in to the afternoon down-draft.

 5 min with immediate distribution in to an AAPL gap up as has been the case for the last several months, some smaller signals and the 5 min in an overall leading positive position.

The 15 min chart (Telechart) with a leading negative divergence in to the early January highs and a pretty large leading positive divergence in a very flat range (typically flat ranges are where we see some of the heaviest buying and selling, which probably comes as a shock to most people trained in classic Technical Analysis.

The point of the post really was the DeMark video, I thought I'd just add some of our flavor.