My thoughts on Friday were two-fold..
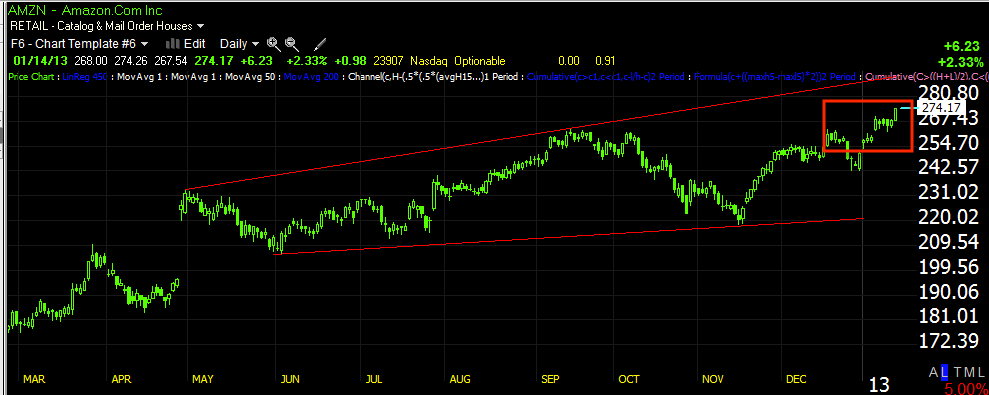
"Ideally AMZN looks the best above $269"
"if I had time I'd probably add to the AMZN short opened this week I believe it was. I'd prefer not to be at a full position yet until the market is in line as well."
The market being in line as well is for pretty obvious reasons, the market is responsible for probably somewhere around 65% of the gravitational pull on any given stock on any given day (of course excluding stock specific events), simply said, most stocks move with the market so having the market in line with the individual position is a no-brainer.
The reason I'd prefer not to be at full-size in AMZN yet (as of Friday) is because of this...

There are a lot of other reasons as well, I can't list them all here, that's why I wrote the first 2 parts of the 3 part article, "Understanding the Head-Fake Move", there are a lot of reasons. I'll be sure o get a link to those two articles up on the right side of the site so you can reference them. Look at the Industry today, retail, it's up about .30% so this move isn't about a strong retail sector, the sub-sector is up a bit over 1%, but that's because of the 17 components, AMZN and EBAY are the biggest and EBAY(-1.21%) isn't performing like AMZN. I have little doubt this move is all about predictability of technical traders and that clear resistance zone that would move them to action as well as hit existing orders. It wold also just be silly to leave that much money on the table because you didn't make a move above resistance (the bid/ask spread, HFT trading, locals' trading, volume rebates and that's not even considering the bigger picture)


So far the 1 min chart is moving the direction I'd expect and want to see, I'd like to see the others follow and I suspect as the 1 min is getting worse in a short period of time, they will follow and that's where I'd like to add to AMZN.
If I had to make a choice this second to add or miss the chance, I'd add no doubt. However I do prefer to have the strongest signals so in light of that, I'll be patient, but I like what I see so far.


No comments:
Post a Comment