Monday, January 14, 2013

Leveraged ETFs

I had a question from a member about which leveraged ETF I liked better, really to me it's a function of the underlying asset and they should move according to their leverage  although there are always slight distortions. The amount of leverage in a trade for me depends on a lot of different things, for example the SLV long idea from Friday was expected to be a short term trade, to make it worthwhile (and keeping in mind it did have a strong positive divergence on a 3 min chart) I'd prefer to use leverage, whether that be in an ETF or options would probably depend on liquidity, but I'd probably lean toward Calls.

If I had evidence suggesting SLV could be a longer trade, maybe a swing trade, then I'd want to use a 2-3x leveraged ETF so I can sit through any corrections and not have to close out the options position and re-open it every time I thought there was going to be a correction (the more times I have to make a judgement about when to get in and out, the greater my chance for getting it wrong-I'd rather use less leverage and ride the corrections out).

If I'm looking at a core position, something I'm building my portfolio around and expect a longer term trending trade, then I'd prefer to be actually short the stock itself (assuming there isn't a very big dividend). This way I can let the trade work and not be overly concerned about it. Just about every core short from Q1 of 2012 was checked on average about once a week, as long as the market wasn't flashing red flags, I wasn't too concerned about those and every one of the 9 positions was showing a double digit return.

There are some advantages to actually being short rather than buying a bear /short ETF. For 1, you may not notice, but most days in the market are just noise and don't substantially contribute to the trend, it's usually a select few days that make the trade (another reason I don't want to be hopping in and out with options).

The 16 white days of the 39 days in this IWM uptrend are the only days that added anything to the trend; of those there were only 5 that added more than 1% to the trend; 23 days were just noise, nothing happened.


An ETF "Can" get chewed up in a lateral consolidation because of the compounding of leverage. Most ETFs are managed for 1-day returns, not a week or month.

Example: ETF is long and at $10, the next day it moves up 10% to $11, the next day it moves down 10% to $9.90, then it moves up 10% to $10.89 and the next day down 10% to 9.80. Now do the same calculation but add in 2 to 3 times leverage and the probability of the ETF seeing some slippage that may not be in your favor (the ETF doesn't return exactly 3x the underlying).

Another reason I prefer a straight short position is the ability to use profits to pyramid up the position, I wrote about it quite a while back at Trade-Guild.net. 

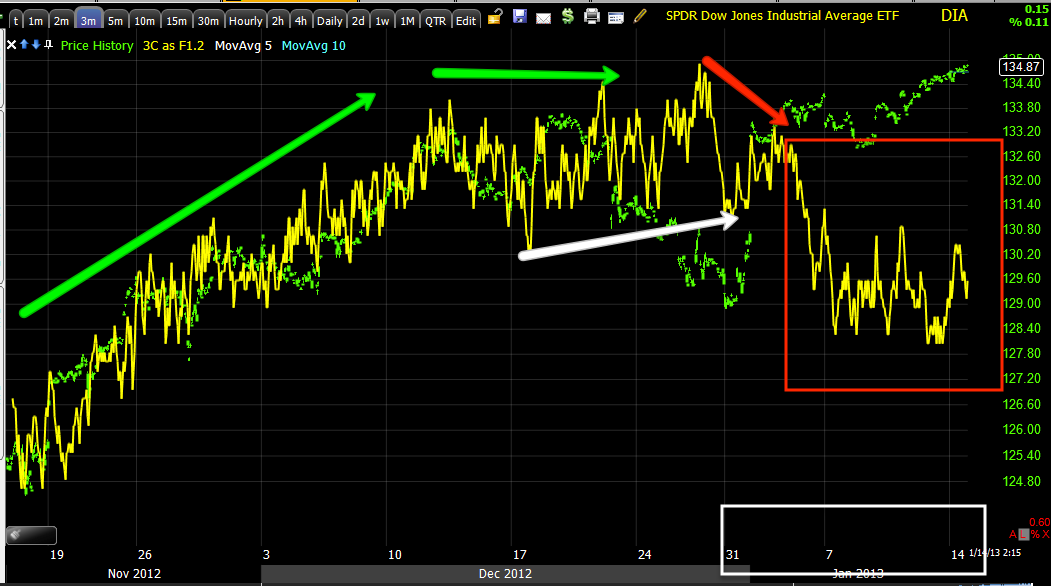
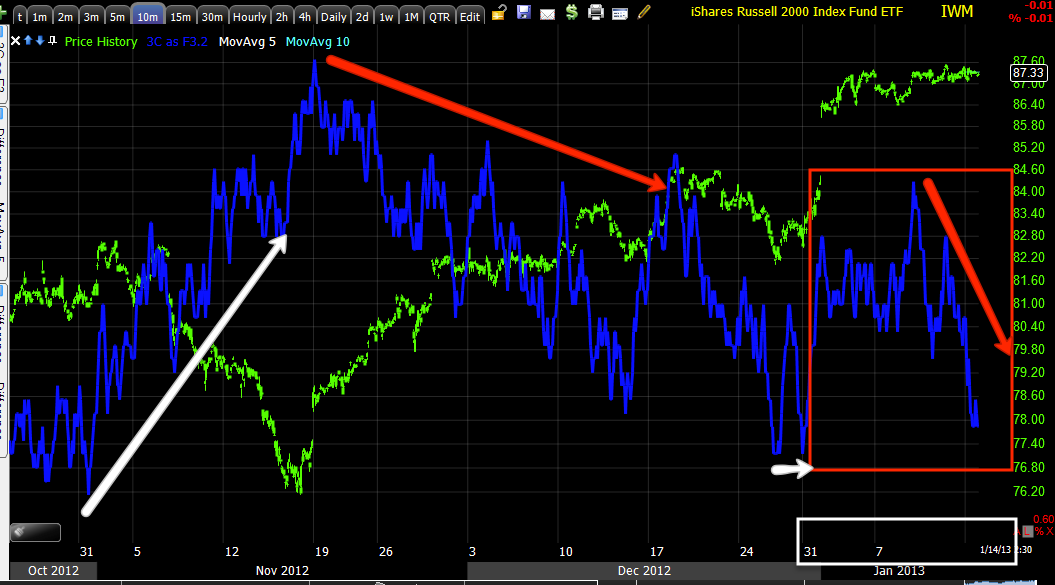
However the real point of this post is this, in looking around at some 2 and 3 times leveraged ETFs as well as the underlying asset, I noticed in several instances the lower leveraged ETF was showing better signals. Now to be fair it wasn't like that with all of them and I didn't do an exhaustive study or backscan the entire class of leveraged ETFs, but this actually does make some sense considering the market looks like this recently...

Considering the above, it would make sense to me that 3X leveraged positions would be accumulated as close as possible to a reversal point. As far as the actual performance it shouldn't make any difference.

However a few other things you should realize about ETFs, of the 1326 in my system that are members of the NASDAQ, NYSE and AMEX; 2 were on the AMEX, 89 were on the NASDAQ and 1225 were on the NYSE.

The reason I mention it is because the NASDAQ opens at 9:30 and the bid/ask are determined by the participants of the market maker if there is no bid/ask. An NYSE specialist can open a particular issue whenever they feel like it and the opening is arbitrary, the specialist looks at the book and opens the stock where they believe it should be, a lot of day traders figured out how to make money on NYSE stocks because of that in gap situations.

From my own personal experience, I had what would be something like a 6% profit on an ETF, SKF (2x short Financials), but the specialist didn't open SKF for trade until after 10 a.m. and by then my profit had disappeared, nothing I could do about it.

Just some random things to chew over.

Follow Up to Nerve Racking

When the longer term charts like 15 min are already negative , the bias for the short term charts is to turn negative and we were already seeing that at the last post.

Now the DIA 2 min is leading negative sharply lower, the 3 min is negative, the SPY 1, 2 and 3 are all leading sharply lower, SPXU by the way is leading positive in the same timeframe.

QQQ 1 and 2 min are holding on better, but 3 and 5 min are horribly negative. Strangely IWM is pretty much in line with a slight bias to the POSITIVE on the 5 min chart. Strange.

Silver/SLV Follow Up

Friday I posted a trade opportunity in Silver/SLV

Because I hate analyzing SLV which is manipulated from every direction and because there isn't any overwhelmingly strong signals for longer term trade, I said

"If you are very nimble with good risk management skills, SLV/Silver looks like it's a quick long play, I mean quick, like dead cat"


SLV is up over 2% today and about +2.5% since the post. 

Honestly the trade idea was based on 1 chart that had a high probability move short term as described in the original post, that high probability signal is no longer there. I'm not saying the trade is done, just I no longer see any reason or edge in the trade.


Friday SLV has a nice strong leading positive divergence, perfect for a leveraged trade. Today it's in line so there's no edge today like there was Friday. I wouldn't enter SLV today so I see no reason why I would hold it.

AMZN Update

I'm going to hold right here on AMZN  for a bit and wait to see some more movement.

 1 min

 2 min

3 min

I just hope I don't regret not taking action (adding ) here, but I've always been glad when I've been patient and waited for a signal that you just can't pass up.

Nerve Racking

With charts looking like this, this is getting pretty nerve racking as we have seen the market tumble from less. The only saving grace for the market right now is Leading indicators, specifically Credit and FX.

 When the 15 min (SPY) chart is already this negative, it's in trouble that we've seen snap in much less of a negative position.


 With short term charts coming up negative, and the market needing to be manipulated with volatility just to stay out of the red, that sounds like trouble.

 IWM 15 min, I'm surprised this hasn't collapsed.

 IWM 10 min locally has seen a lot of damage

 QQQ 15, again seen the market collapse on much less.

 short term it's not gaining any ground either

 Yields are negative so that's one area that is acting as it should

 Yields

The Euro is still catching a bid and giving some support to the market and commodities.

Credit is in line with the market, this is really the one I expect to see turn, almost every decent reversal Credit has turned first.

Once Again, Volatility is used in the afternoon session

This has become a predictable habit, when things get this predictable they tend to change.

VXX (VIX Short Term Futures) in green, SPY in red and the same thing they were doing all last week and probably beyond. There is some interesting volume in VXX near the lows of the day, might be something to watch. UVXY had a different volume pattern, but still an increase around the same area.

Market Update 3 of 3

Hopefully this helps you put together the bigger picture, the transition between trend 1 and 2 and if you pay attention you'll find a lot of common market behavior and some interesting characteristics that show market action in a whole different light, the easiest way to understand it is to imagine that you were running a portfolio that had positions that amounted to a million dollar or tens of millions (or more) of dollars per position. This is how you can better understand why certain things happen so often and why there's an order to how they happen.

I'm not going to explain every chart, but I'll try to give you the important areas and timeframes, of course the longer the timeframe, the clearer the trend (that has some caveats, but not here).

 DIA 1 min trend, the 31st of December was the start of trend #1, you may see those dates highlighted below. Note the change in character around the 10th, that's when we moved above the 1/4 SPX highs and the area which I expected to see this kind of action.

 2 min with both Trend #1 and the move above 1/4 highs highlighted

 DIA 3 min, same

 DIA 5 min, also same, remember the fastest charts will have the most defined divergences.

 The 15 min shows to the left at the white arrow the 11/16 cycle lows, there was accumulation in to those lows, they started this cycle that I believe trend #1 is the end of.


 This 4 hour chart is really not the trend we are looking to trade, but it does give the broad strokes and makes them very easy to see.

 QQQ 1 min with Trend #1 and the move above the 1/4 highs

 QQQ 2 min trend shows accumulation in to trend #q and then the negative divergence after the 10th-above 1/4 highs

 QQQ 5 min, the depth of the leading negative divergence at trend #1 is why I think it's the end of this cycle since 11/16.

 QQQ 15 min, the same could be said


 IWM 1 min trend

 IWM 30 min trend from the 11/16 cycle lows

 I don't know why this uploaded after the 30 min, but IWM 15 min at trend #1 and the move above 1/4 highs

 IWM broad stroke on the 2 hour, this isn't anything we are trading, it just shows how far and serious this area of the divergence is.

 SPY 2 min trend

 SPY 3 min trend-again trend #1 and what happened after moving above the 1/4 highs is what's important here.

 SPY 5 min trend of trend #1 specifically action above the 1/4 highs


 SPY 10 min and the leading negative of trend #1


SPY 15 min and the leading negative of trend #1, this is why I think it's so important as the bridge between trend 1 and 2, trend 2 should cross below the 11/16 cycle lows

Quick Intraday Update


Since the last intraday update I see the QQQ positive divergences are losing momentum, the SPY which was flat is losing momentum and going negative, the IWM still has a 2 min positive divergence, that may not last as the 1 min is turning negative and the DIA is leading negative in every intraday timeframe out to 5 min (looking at today's move only).

Update 2 of 3

I'm putting these out in 3 separate posts because some of you need the most current information fast, but I'd prefer to put this all out in 1 post so everything can be seen in context,  a 1 or 2 min positive divergence can look impressive, but if it's not seen within context it can be very misleading and cause you to miss opportunities, to get worried about something that's inconsequential or not take something serious that is consequential.

As most of you know, the 1-3 min timeframes are largely intraday, they can give larger signals when viewed as a trend and they can move the market overnight and a little beyond (we've seen that a few times last week with closing divergences). The 5 min chart is where heavier activity first really starts to show up. 10-15 min charts have called some pretty decent size moves, the 30-60 min charts are really telling you more about the real health of an issue and which way the shorter charts are biased, which way the probabilities are skewed to.

OK, so here's intraday charts, they can move fast so some may have already changed and I'll try to note that if it's the case. I've noticed some short term rotation or at least what I would call differences in relative performance (as far as the signals go).

 DIA 1 min has a 1 min negative divergence here, when I mention relative performance (re: 3C) compare this to the QQQ 1 or 2 min charts.

 DIA 2 min is in a leading negative divergence, this is the second in a row.

 This 5 min chart gives a broader summary of the intraday charts above, again I think it's important to realize that the signals really start developing only AFTER the SPX moves above the highs of 1/4 on 1/10. The reason is not so I can say, "See I told you so", the reason is that there's information there that is important, like AMZN above resistance, it's the same concept because this is how the market behaves out of necessity, tha'ts why it was easy to predict it.

 IWM 1 min with very recent improvement, this still looks the same.

 IWM 2 min, note the relative performance difference between this 2 min IWM chart and the DIA above. This looks slightly better, very slight.


 The 5 min chart is what I'd call close to in line or flat, the most recent bias is more positive, but not by much.

 QQQ negative through Friday afternoon and in to the close, this intraday divergence did not materialize Friday, but it seems obvious that it was being set up for Monday's open, remember the market makers, specialists, HFTs, etc are experts in reading the tape, seeing the depth of the entire book, they have a good idea of what is coming and considering Market Makers on the NASDAQ alone, they use to be responsible for about 30% of the day's volume simply trading their own accounts. All of those nickels and dimes add up. This looks a little different, but I don't think the interpretation would differ much, it's slightly positive intraday.


 QQQ 2 min, this is stronger now, it has made another higher high in 3C which would now be the highest on this chart. Again, it seems Friday inventory was adjusted or sold and right now it's being adjusted and bought, but keep in mind how short term Friday's adjustment was (the % move in the QQQ and duration).


 The 3 min chart I would think would see some positive bleed over or migration, that's not the case, this tells us that so far the signals above are not that strong.

 SPY 1 min had 1 leading positive area earlier, it's been in line since, it still is.

This is the intraday NYSE TICK chart above, much like last week, especially Friday, this is VERY flat, very boring. The TICK is the number of NYSE advancing issues minus the declining issues, there are very few times it is range bound inside +750 and -750, that reading is almost like saying there's complete balance and there's no bullish or bearish edge among stocks actual performance. This chart is currently at +51 (of all NYSE stocks this minute there are 51 more that are advancing than declining, ZERO would be absolute balance between the two).


SPY 2 min is seeing a sharper 2leading negative divergence.

 Now you can see the difference in relative performance, DIA not so good, the IWM between as well as the Q's and the SPY pretty flat. If all of the averages can't get it together and look the same way on at least the intraday charts, there's a pretty fractured market.

The next update will put these charts in context of at least trend #1 & # 2.

Market Update 1 of 3

First we have a small intraday positive divergence, mostly led by ES, the IWM and the Q's.

The next update will show you the intraday action and then the 3rd will show you where it fits in to the bigger picture re: trend 1 and 2